Echoes of 1974

Each year brings investors a fresh list of hopes and fears. Often, mainstream financial firms provide guidance that extrapolates linear thinking into the future. We prefer to take a more cyclical view of the world to glean knowledge from patterns in past cycles that rhyme with today. With that in mind, we set our sights back 50 years ago to 1974, just long enough for most investors to have forgotten those events, and the lessons associated with them. There are five key lessons from that period that we believe are relevant to investors today.

Lesson 1: Inflation & Interest Rates – Volatile But Trending Upward
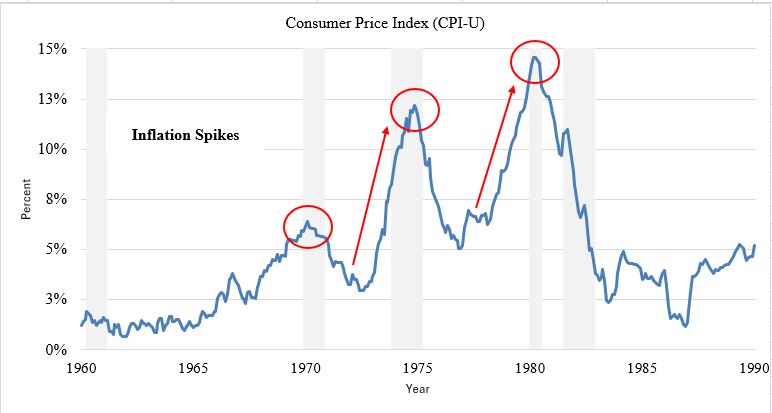
After experiencing renewed inflation in the early 1970’s, 1974 was an inflection point that marked a relative high in annual inflation of 11.1% and interest rates 10.5% (short-term T-bills) and 7.6% (10-year Treasuries). A significant recession hit in 1974 and inflation and interest rates fell. Like today, the consensus was that rising inflation and rising rates were a “blip on the radar” with the worst likely behind us. However, inflation and interest rates aggressively reasserted themselves several years later in a second major upcycle in the late 1970s. Inflation soared to 13.5% at its 1980 peak, pushing interest rates to 16.4% (short-term T-bills) and 13.9% (10-year Treasuries) by 1981.
1

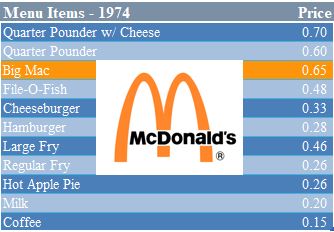
Despite the inflation at the time, a Big Mac at McDonalds was only 65 cents, and it was actually called “Big” for a reason!
2

The Lesson Today:
While inflation fell leading into 2024 and 10-year Treasuries remain around 4%, inflation is not dead. It is wise to prepare for a second, bigger wave of rising inflation and interest rates in the coming decade. That said, 2024 may bring a continued temporary lull in inflation and interest rates if global economies weaken. The big caveat for this “lull scenario” is the massive Federal debt levels relative to 1974. The official national debt has surpassed $34 trillion and added a whopping $1 trillion in the last 30 days alone! The question is not who will buy the debt, as there will always be takers at the right price. The question is what interest rate will be demanded by investors.

Lesson 2: Extreme Stock Valuation Led to Pain
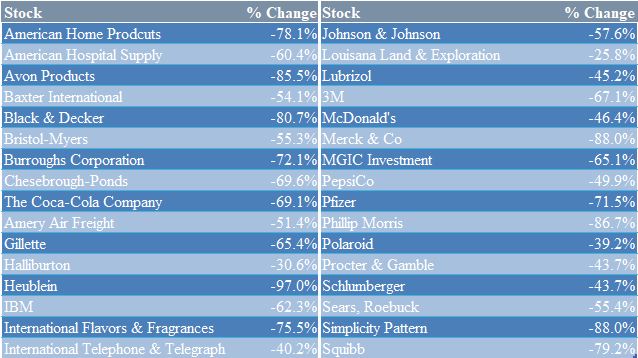
Today’s Magnificent 7 tech stocks have led the S&P500 with extremely narrow stock market leadership.3 Their valuations continue to rival periods such as the 2000 Tech Bubble and the Nifty Fifty from 1974 (a basket of 50 stocks that people believed would lead to outsized returns with a single buy-and-hold proposition). These stocks were the leaders of that era until their ultimate crash into the recession of 1974 when most lost 50% to 80% of their value.
4

The Lesson Today:
When investors fall in love with a narrow group of expensive stocks that have pushed up the stock indices, markets are at risk to greatly disappoint (or crash). Today, the S&P500 has been mainly driven by just seven stocks or approximately 1.4% of total stocks in the index. This suggests the near-term prospects for equities are challenged barring any surprise return to money printing. Although money printing will return, it will take significant pain in the stock markets first for the Fed to justify it.

Lesson 3: Political Instability Rising
President Nixon was the first president to “voluntarily” resign in 1974 amidst the Watergate scandal. This led to an era of distrust and loss of confidence in the government and economy for nearly a decade. Today, the political environment is rife with instability as we enter an election year with a divided country, polarized views, and questions at every level of government.

The Lesson Today:
Politics is a key factor in the confidence of a healthy, functioning capitalistic system. When markets feel at risk and do not trust the institutions or the rules, faith can be lost and not easily recovered.

Lesson 4: War, Energy & the Middle East
The Yom Kippur War between Israel and several Arab nations in the fall of 1973 led to an oil embargo and spike in energy prices. Eerily, another conflict in the Middle East began last year one day removed from the 50th anniversary of this war, sparking many unknown, long-term consequences.

The Lesson Today:
War in the Middle East has many geopolitical implications. It risks dividing countries and causing an unknown future impact on energy markets. Global war, if this were to expand, often goes hand in hand with difficult economic times in history. War has always been a great excuse to tear things up and rebuild them, but not always to benefit of the average citizen.

Lesson 5: Changing of the Guard in Currencies Every 100 Years
The early 1970s was a critical time for the U.S. dollar. What had been a pre-World War II system of currencies disciplined by the backing of physical gold or silver morphed into a dollar system under the Bretton Woods Agreement. However, holders of dollars became increasingly nervous in the early 1970s as U.S. spending was seemingly out of control (imagine if they could see things today!) due to social programs and the Vietnam War. The Bretton Woods system promised the dollar could be converted to gold – until it couldn’t. France led the charge to redeem dollars for gold. This resulted in President Nixon’s famous 1971 speech in which he was “temporarily suspending the convertibility of the dollar to gold”. Of course, like most things from the government, temporary programs never go away. From that point forward, the dollar was simply printed out of thin air without constraints.

Today, we are nearing another critical event in the life of the dollar – a rise in nations circumventing the dollar system as seen in the growing alliance of BRICS countries expanding non-dollar denominated trade.5
6

The Lesson Today:
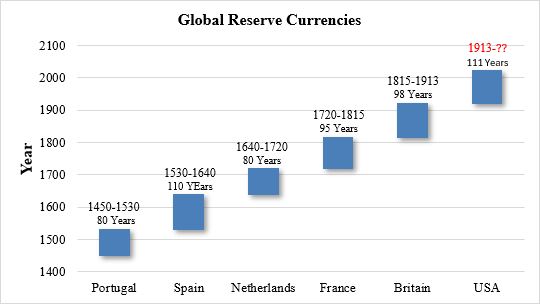
No reserve currency has lasted more than approximately 100 years. Given this, the dollar is late in its life cycle as measured from the 1913 inception of the Federal Reserve system. While the dollar is not on its immediate way out, we envision world trade and capital markets becoming more multi-polar as reliance on the dollar fades. Eventually, the reality must be faced that the U.S. national debt cannot be serviced without creating a death spiral of more money printed just to service debt. Other world currencies face a similar predicament with no likely predecessor. Thus, the world will likely start a gradual, and then sudden path back to sound money (likely precious metals and perhaps cryptocurrencies) – not by choice, but by necessity.

Endnotes:

  1. Board of Governors of the Federal Reserve System (US). “10-Year Treasury Constant Maturity Rate.” FRED,
    Federal Reserve Bank of St. Louis, 2 Jan. 1962, fred.stlouisfed.org/series/DGS10/.
  2. “Vintage McDonald’s Menu from the 70s Reveals How Much Has Changed over the Last 40 Years.” Throwbacks,
    31 Aug. 2023, throwbacks.com/vintage-mcdonalds-menu-from-the-70s-reveals-how-much-has-changed-over-thelast-
    40-years/.
  3. Magnificent 7 stocks: Alphabet, Amazon, Apple, Meta, Microsoft, Nvidia, Tesla
  4. “Revisiting the Nifty Fifty.” Stray Reflections – Revisiting the Nifty Fifty, strayreflections.
    com/article/252/Revisiting_the_Nifty_Fifty.
  5. BRICS: Brazil, Russia, India, China, and South Africa
  6. “World Reserve Currencies: What Happened during Previous Periods of Transition? Economic Reason.”
    www.economicreason.com/usdollarcollapse/world-reserve-currencies-what-happened-during-previous-periods-oftransition/.
What Stops the Stock Market Rally?

August, 2020

In terms of magnitude and shortness of time, the stock market rally since its March lows has been unparalleled. Yet it is especially notable given negative economic reality (an annualized second quarter GDP plunge of 32.9%) and diminished company earnings (S&P500 earnings down 50%).1 Will this rally continue? If not, what stops the stock market rally?

Numerous threats exist: continued economic deterioration (a case can be made a recession hit before the lockdowns) and bankruptcies, trade and geopolitical strife with China, civil unrest and mass unemployment, renewed lockdowns due to a Covid resurgence, the loss of hope for a timely vaccine, and a negative economic viewpoint of a very possible Biden presidency.

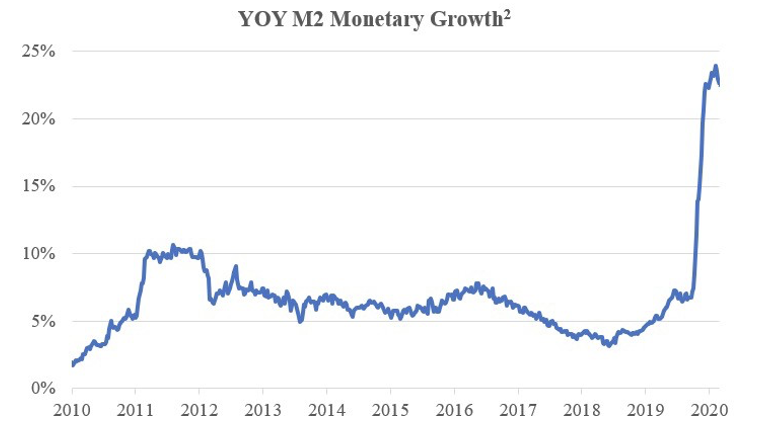
Either mitigating or masking these risks stands the Federal Reserve’s unprecedented actions since March. Although it intervened with numerous programs and purchased a multitude of assets, its actions can be neatly summarized as having massively increased the money supply. Measured in M2 (a commonly cited definition of money) year-over-year growth since the end of the last recession, the money supply has exploded.

Monetary expansion is singularly responsible for the stock market rally. As such, to ask what stops the stock market rally is to question what stops the Federal Reserve.

Chairman Powell is unlikely to voluntarily withdraw monetary stimuli. He learned that lesson (it is no coincidence that the late 2018 stock market decline occurred after a long-term slowdown in monetary growth).

So short of this development, what external factors may prevent the Federal Reserve from pursuing its current monetary course? Theoretically, why is it that central banks cannot forever increasingly print money to ensure ever higher equity prices?

Murray Rothbard, the Austrian school economist and monetary expert, addressed this issue:3

. . . the boom is kept on its way and ahead of its inevitable comeuppance, by repeated doses of the stimulant of bank credit. It is only when the bank credit expansion must finally stop, either because the banks are getting into a shaky condition or because the public begins to balk at the continuing inflation, that retribution finally catches up with the boom. As soon as the credit expansion stops, then the piper must be paid . . .

The “shaky condition” of banks may derive from low absolute interest rate spreads and unsustainable financial leverage alongside increasing bad loans. It will develop with sustained negative real rates (as it has in other parts of the world).

Assuming a banking crisis is averted, what about inflation? Few under 50-years old can remember, let alone experienced, an inflationary environment as a consumer, but could one be starting now? According to the August 14th issue of Barron’s magazine:4

A trifecta of inflation numbers came in hotter than expected this past week, with consumer prices, producer prices, and import prices for July all rising at faster paces than economists anticipated. Notably, consumer prices – excluding the more volatile food and energy categories – rose at the quickest clip since 1991.

It may not be starting now, but it could be. And unlike the 1970’s, the Federal Reserve will be unable to deflect blame at greedy business owners or higher oil prices. What they once could play off as coincidence will now reek of causality. And if they stop inflating, then any rally could turn to rout.

Endnotes:

  1. S&P500 Down Jones (95% of companies reporting)
  2. Federal Reserve Bank of St. Louis
  3. Rothbard, Murray N. Economic Depressions: Their Cause & Cure. Ludwig von Mises Institute. 2009.
  4. ‘Stagflation’ Looms Over This Market. Why Some Analysts are Worried. Bellfuss, Lisa. Barron’s. 14 August 2020


The Kitchen Sink

April, 2020

By late January, the die was cast: the virus had a name, it had reached our shores, travel screenings and restrictions were in place, and while not yet declared a pandemic, the World Health Organization declared COVID-19 a “Public Health Emergency of International Concern.”

Yet complacency reigned within financial markets. The stock market continued its march to new highs (reached on February 19th). The Federal Reserve, in its January 29th press release, failed to mention coronavirus in the list of variables it “will continue to monitor” save for a generic nod to “global developments.”[i] It began the missive by mentioning recent data “indicates that the labor market remains strong and that economic activity has been rising at a moderate rate.” Famous last words.

It was not until a full month later, and only after the U.S. stock market suffered its worst week since the Great Recession, did the Federal Reserve act. It was rather weak work. On February 29th they issued a statement describing how they were “closely monitoring . . . the evolving risks of the coronavirus to economic activity.”[ii] On March 3rd, they cut interest rates by a not uncommon 50 basis points.

But on March 15th, the Federal Reserve completed its year-to-date journey from satisfaction to concern to sheer panic. That Sunday’s emergency announcement marked the first of several major measures meant to stop the bleeding on Wall Street and stem the tide of anticipated economic hardship.

The Federal Reserve’s actions are unprecedented in both magnitude and breadth and will generate serious repercussions for investors down the road.

While the financial media widely reported how the March 15th actions lowered the federal funds target rate to 0.00-0.25%, it missed the far more drastic action of eliminating bank reserve requirements. Previously, banks had to retain 10% of demand deposits which meant they could theoretically increase the money supply by ten times. Now no limit exists to their monetary expansion.

March 23rd brought more unprecedented action when the Federal Reserve announced it was buying $375 billion in Treasuries and $250 billion in mortgage backed securities that week. For comparison, 2008’s QE1 was $700 billion (comparable in size) and it took months to deploy. It also announced it would continue buying assets “in the amounts needed” to support the economy. It started buying, for the first time ever, corporate and short-term municipal bonds.

Then, on April 9th, the Federal Reserve announced $2.3 trillion in loans to “support the economy.” Not content with corporate and municipal, it started buying junk bonds. It could have saved itself the trouble of buying various bond sectors by simply writing a check for most of the office real estate ($2.5 trillion), farmland ($2.7 trillion), or multi-family housing property ($2.9 trillion) in the U.S.

The Federal Reserve’s substantial and sustained efforts to pull the economy out of the 2008 Great Recession increased its balance sheet by $3.6 trillion in just over six years. It just added $2.3 trillion to its balance sheet in a month.[iii] This isn’t throwing the kitchen sink at a problem – it’s lobbing in the entire kitchen.

Even if the Federal Reserve stopped further actions and ceased its announced programs, its balance sheet will continue to swell as it finances proliferate spending by the U.S. Treasury. Given such actions as the CARES Act and its Paycheck Protection Program, the Congressional Budget Office estimates the 2020 deficit will reach $3.7 trillion – a multiple of anything seen in the wake of the 2008 Great Recession.[iv] This estimate will only increase with any additional spending initiatives by Congress.

Money supply has already exploded and is at the fastest rate in 92 months.[v] It is just getting started.

In response to 2008, the Federal Reserve increased the money supply dramatically, but much of that was held by commercial banks in excess reserves at the Federal Reserve where they earned some small, yet risk-free, interest. This time is different. Not just in magnitude, but in breadth, which is to say by recipient. No longer will money be injected into banks and primary dealers, but to companies and individuals who make up the economy as whole.

Inflation will ensue. Not right away, for the deflationary forces of loan repayments and defaults will counteract and potentially overwhelm inflationary forces. But that will be somewhat temporary.

Until then, it is an opportune time to build up inflation protections for an investment portfolio: certain types of real estate (e.g., farmland and some residential rental property), precious metals, and cryptocurrencies.

Endnotes:

  1. Federal Reserve Bank of St. Louis. Timeline of Events Related to the COVID-19 Pandemic. https://fraser.stlouisfed.org/timeline/covid-19-pandemic#14
  2. Federal Reserve Press Release. 29 Jan 2020. https://fraser.stlouisfed.org/title/federal-open-market-committee-meeting-minutes-transcripts-documents-677/meeting- january-28-29-2020-585165/content/pdf/monetary20200129a1
  3. Federal Reserve Bank of St. Louis. Federal Reserve Total Assets. https://fred.stlouisfed.org/series/WALCL
  4. “Coronavirus Relief Pushing U.S. Deficits to Staggering Heights” Associated Press. https://www.pbs.org/newshour/politics/cbo-says-deficit-to-reach-3-7-trillion-in- economic-decline
  5. “Money Supply Growth Surges to 92-Month High” McMaken, Ryan. Mises Institute. https://mises.org/wire/money-supply-growth-surges-92-month-high


SOMA for the Masses

February, 2020

The world’s stable now. People are happy; they get what they want, and they never want what they can’t get. They’re well off; they’re safe; they’re never ill; they’re not afraid of death; they’re blissfully ignorant . . . they’re so conditioned that they practically can’t help behaving as they ought to behave. And if anything should go wrong, there’s soma.

– the Controller in Brave New World by Aldous Huxley, 1932.

In Huxley’s story, soma is a government-provided drug which helps people escape the real world by artificially enhancing their joy, arousal, and overall sense of well-being. Coincidentally, in our financial and economic story, the Federal Reserve (“Fed”) increases their SOMA (System Open Market Account) by buying assets with freshly printed money for the same purpose. So, while Huxley’s future citizens drank soma or ate it in infused strawberry ice cream, today’s financial markets consume the Fed’s monetary infusions to the same effect.

Quantitative easing waned starting in 2017 as the Fed actively sold bond holdings (for which they receive money which then leaves economic circulation). As detailed in the chart below, this situation reversed in late 2019.

Ostensibly, the reason was to “calm money markets” last September when they experienced . . .

. . . funding shortages Monday and Tuesday [September 16th and 17th], driving the rate on one-day loans backed by Treasury bonds – known as repurchase agreements, or repos – as high as 10%, about four times greater than last week’s levels.(1)

The Fed’s interventions in the repo market have continued unabated. On February 4th alone, Fed purchases totaled $94.45 billion. Since repos are reversed in a fairly short time frame, the impact of any intervention must be netted against such reversals. But even after such considerations, the overall level of outstanding repos owned by the Fed stands at $187.2 billion.(2) All of this comports with the Fed’s operating policy as detailed in a December 12th statement.(3)

But could there be another reason? The fact that these repo operations serve as de facto quantitative easing without the stigma of citing economic concerns cannot be dismissed as a convenient coincidence. Since December 2018, when the stock market decreased dramatically and Treasury Secretary Mnuchin startled Wall Street with his “ample credit” statement at Christmastime, the Fed has been a bit scared and highly reactive.(4) The repo market simply provides them public relations cover to continue their post-2008 monetary mischief as measured in the SOMA. The financial markets are truly living in a Brave New World.

Endnotes:

  1. McCormick, Liz and Harris, Alex. “Fed’s First-in-a-Decade Intervention Will Be Repeated Wednesday” Bloomberg. 17 September 2019.
  2. Derby, Michael. “New Fed Repos Total $94.45 Billion, Total Temporary Money Ticks Up To $187.2 Billion” The Wall Street Journal. 4 February 2020.
  3. Statement Regarding Repurchase Operations. Federal Reserve Bank of New York. 12 December 2019.
  4. Paletta, Damian and Dawsey, Josh. “Treasury secretary startles Wall Street with unusual pre-Christmas calls to top bank CEOs” The Washington Post. 23 December 2019.


The Tariffying Prospect of a Trade War

July, 2018

David Letterman, Oprah Winfrey, Phil Donahue, and Larry King – future President Donald Trump hit the talk show circuit extensively in the 1980’s and 1990’s. These interviews provide an insightful look into his core beliefs. Consistently, the most passionate commentary concerned foreign nations “taking advantage” of the U.S. – either by failing to contribute more to their own national defense or by running significant trade surpluses (U.S. trade deficits). In these interviews, the latter of which was usually directed (given the time period) at Japan. Today it is China.

Some argue that President Trump is actually in favor of free trade but wishes to renegotiate various trade treaties. That is, by embracing protectionist policies, free trade can be broadened on more “appropriate” terms. For example, some of the stated NAFTA renegotiation objectives include the elimination of “unfair subsidies, market-distorting practices by state-owned enterprises, and burdensome restrictions on intellectual property.”1 Perhaps this is indeed President Trump’s ultimate goal, but this interpretation is contrary to significant evidence in addition to his own talk show confessions.

First, protectionism is theoretically consistent with President Trump’s immigration position. If one believes immigrants take away American jobs, then logically one would also fear cheaper foreign goods which destroy the profitability of American companies – and by extension, cost U.S. workers their jobs.

Second, the protectionist measures enacted so far have been consistently indiscriminate in affecting both allies (e.g., Canada, Europe, etc.) and potential foes (e.g., China) – and thus almost all trade agreements – alike.

Third, President Trump, almost immediately upon taking office, pulled out of the Trans-Pacific Partnership. While one could easily argue this agreement actually hindered free trade given its excessively burdensome and complex rules and regulations, the rationale given for withdrawing was a protectionist argument: the preservation of American manufacturing.

Fourth, he has surrounded himself with advisors notorious for their protectionist policy advocacy. Most notable among them is economist Peter Navarro who authored the book Death by China.

If President Trump truly believes in protectionism, and if such advocacy largely helped him win the election, then we should expect this trade war to continue, broaden, and deepen. It likely would have begun last year but for the need to secure China’s cooperation in dealing with North Korea. As evidence, note that the first major tariffs (March 1st) were issued just after U.S.-North Korean relations started thawing with Kim Yo Jong’s (sister of Chairman Kim Jong Un and special emissary) overtures at the Winter Olympics (which ended on February 25th).

If the trade war escalates, can it directly cause a U.S economic recession? Many mainstream pundits, citing the infamous Smoot-Hawley Act of 1930, warn as such (which is odd, especially since the Great Depression was well underway before it was enacted let alone took effect).

It is rising interest rates which directly cause recessions as the origin of recessions lies in the preceding, artificial boom. When a central bank increases the supply of money, interest rates are artificially lowered. Since interest rates are a universal market signal to all businesses, investments which previously appeared unprofitable now make economic sense. However, the attractiveness of these projects is a mirage. These borrowed funds are actually being “malinvested” given the “true” level of interest rates absent the artificial stimulus. When interest rates eventually rise as monetary stimulus is lessened, the disruptive liquidation of the malinvestments in the ensuing downturn is known as a recession.

But tariffs may indirectly cause a recession. Currently, U.S. Treasury debt held by “Foreign and International Investors” is almost $6.3 trillion. China alone accounts for almost $1.2 trillion and may not be interested in more.2 In May of this year, it was reported that China had halted its purchases of U.S. Treasuries.3

If foreign demand, led by China, for U.S. Treasuries cools (let alone if China liquidates its holdings); expect higher U.S. interest rates (all things being equal). If this, combined with the Federal Reserve’s planned liquidation of bond holdings in the face of increased U.S. budget deficits, develops, interest rates may rise significantly. A recession and financial market distress would surely follow. It is a tariffying prospect.

Endnotes:

  1. “USTR Releases NAFTA Negotiating Objectives” Office of the United States Trade Representative. July 2017.
  2. “Federal Debt Held by Foreign and International Investors. Federal Reserve Bank of St. Louis. https://fred.stlouisfed.org
  3. “We Understand the Chinese Government has Halted Purchases of U.S. Treasuries” ZeroHedge. 4 April 2018.


Irrational Complacency

March, 2017

complacency (noun): a feeling of quiet pleasure or security, often while unaware of some potential danger, defect, or the like.

The financial markets feel complacent. Time and time again, stock market investors merely shrug at adverse financial, economic, and political news. Even the Federal Reserve’s rate hike on March 15th failed to elicit a negative reaction. And the statistics support the anecdotes.

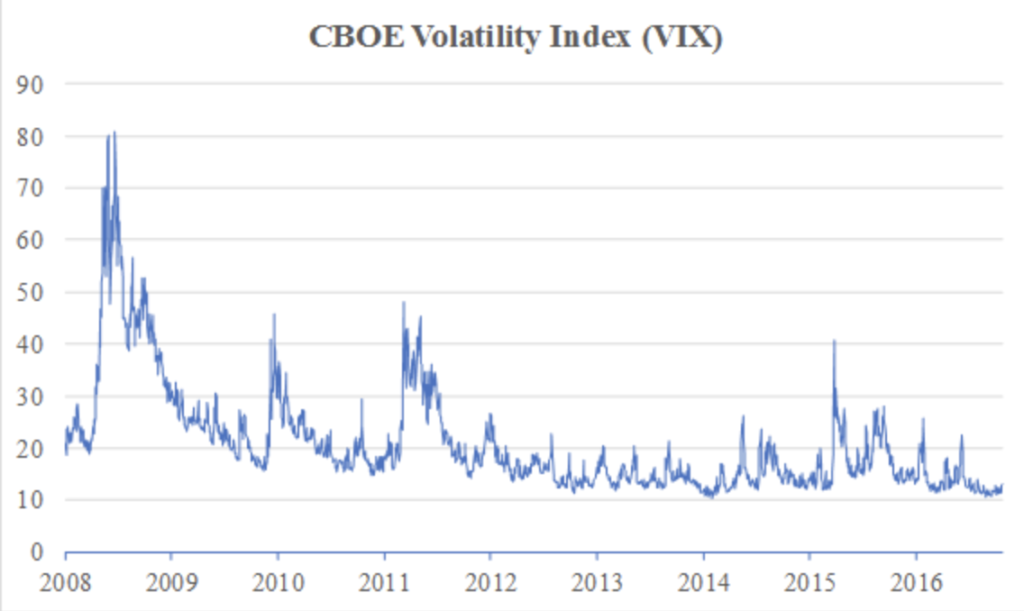
Financial markets typically equate risk with volatility. The greater the volatility generated by stock prices, the greater the risk of the stock market. The most common measure of risk is the Chicago Board Options Exchange (CBOE) Volatility Index, also known as the VIX. Constructed from the implied volatilities of a wide range of S&P 500 index options, it purports to measure expectations about near-term (30-day) volatility.

If high VIX levels indicate fear within the stock market, low levels surely suggest complacency. It is not unexpected, as long bull markets often breed complacency. But the level of worry and fear of a stock market decline has dropped to unusually low levels.

For much of March (through the 24th), the VIX ranged between 11.0 and 13.1, far lower than its median (17.5) or average (20.7) since the summer of 2008. And far, far below highs observed as recently as 2015.1

Even the Federal Reserve appears worried. In its January 31st to February 1st Federal Open Market Committee meeting minutes, the central bank “expressed concern that the low level of implied volatility in equity markets appeared inconsistent with the considerable uncertainty attending the outlook.”2

What are these uncertainties? To name but a few in the near term:

  • Potential additional rate hikes by the Federal Reserve;

  • Likelihood of a European banking crisis with a probable summertime Greek default; Monetary instability if the European election cycle disrupts the future of the eurozone;
  • Potential trade war with China; and

  • U.S. fiscal issues and legislative stalemates delaying or obstructing tax reform.

In December 1996, then Federal Reserve Chairman Greenspan famously implied stock market levels at the time reflected “irrational exuberance.”3 He was early, but he was right (and, quite frankly, he should have been right as he was almost singularly responsible for the dot.com bubble).

If the 1996 stock market reflected irrational exuberance, today’s stock market reflects irrational complacency. Combined with extreme market valuations, investors should be wary, for while sentiment may move markets, eventually reality moves sentiment.

Endnotes:

  1. Federal Reserve Bank of St. Louis. https://www.stlouisfed.org/
  2. Minutes of the Federal Open Market Committee, January 31-February 1. https://www.federalreserve.gov/monetarypolicy/fomcminutes20170201.htm
  3. “The Challenge of Central Banking in a Democratic Society.” Remarks by Chairman Alan Greenspan at The American Enterprise Institute for Public Policy Research, (Washington, DC) 5 December 1996. https://www.federalreserve.gov/BOARDDOCS/SPEECHES/19961205.htm


Defense Wins Games

September, 2015

Football fans always get excited about offensive prowess, but they also know that when it counts, it is the defense that wins games. After a seven-year run in theU.S. stock markets leading to near-record valuations, veteran players know it is time for some solid defense by reducing risk in equity portfolios. The question for investors is: how to play defense in this increasingly uncertain world?

There are three primary ways to reduce equity risk. First, by significantly reducing equity exposure or exiting the equity markets completely. Traditionally, proceeds from equity sales are reinvested in bonds to await cheaper equity prices. This strategy has often worked in prior market downturns – and it may initially work with the next one – but we foresee a day when bonds sell off along with the stock market. It also requires some market-timing expertise.

The second strategy is the traditional diversification model touted by mainstream financial advisers. This model includes a broad mix of higher risk-assets in order to reduce overall portfolio risk. The theory states that, by mixing U.S., international, small and large-capitalization stocks, overall risk is reduced since these stock categories typically do not move in lockstep. This theory has led many investors to actually increase their overall equity portfolio risk (as we have recently experienced) since equities in different corners of the globe can all quickly tumble together during a contagion. So although traditional diversification may prove beneficial during normal times, it fails miserably during periods of systemic crises such as 2008. In our view, record debt levels throughout the world, combined with unprecedented monetary expansion, increase the likelihood of systemic risk.

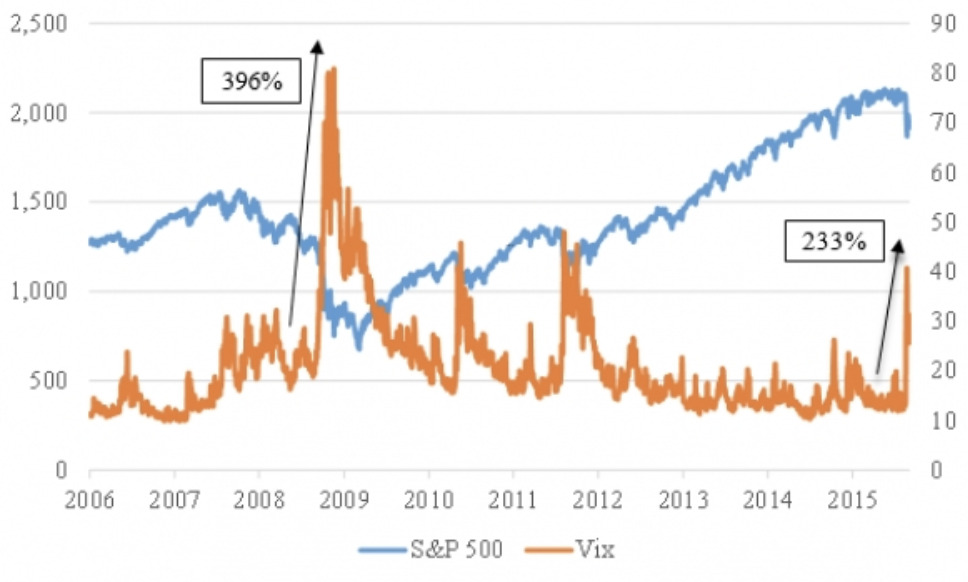
Hedging, the third and most compelling method to reduce equity risk, uses assets which should increase in value as stock markets decline. Traditionally bonds have performed this task, but as discussed above, those days may be ending. An asset which may now fulfill that role is volatility itself. Today, volatility is a tradable investment vehicle. Commonly referred to as the “VIX”, volatility reflects levels of risk in the stock market and rises as investors become more fearful. In two consecutive trading days in late August (2015), volatility rose by over 45% each day. The increase in volatility from the August low-to-high was over 230%!

However, other than periods of turmoil, the VIX is often flat or slowly declining. Therefore, an active-management approach is essential.

There are several investment funds which employ strategies that allow participation in rising equity markets, yet utilize volatility to eliminate or at least mitigate the risk of bear markets. Some volatility investment vehicles can even have exceptional returns during deep equity drawdowns. Even small positions in volatility can provide substantial benefits during market downturns. Today, volatility should be considered a key asset class and legitimate strategy for playing defense against the risk of a systemic crisis.


Lies, Damned Lies, and Government Statistics

November 8, 2013

There are three kinds of lies: lies, damned lies, and statistics. – Mark Twain, 1906[1]

With all due respect to Mr. Twain, he did not extend the thought far enough – government statistics trump all lies. But then again, the government’s role as both a preeminent statistical gatherer and manipulator is a phenomenon more applicable to our time. Today, various U.S. bureaus and agencies monkey with every key macroeconomic indicator, most notably inflation, production (Gross Domestic Product), and unemployment. To wit:

Inflation –

Since the early 1980s, the Bureau of Labor Statistics (BLS) has engineered a lower “inflation” rate in the Consumer Price Index (CPI) with such maneuvers as:

  • Accounting for “quality” improvements in goods (“hedonic adjustments”);

  • Replacing items in the basket of goods measured with lower-price items (“substitution”);

  • Decreasing the impact of rising prices by any particular good within the basket (“geometric weighting”); and
  • Changing how rents are measured (“imputation”).

The results? According to ShadowStats, which calculates inflation with the previous CPI methodology, inflation has been understated by five to six percentage points over recent years.

Gross Domestic Product –

GDP, to the extent it is relevant at all, must be assessed in real terms (discounting the effects of inflation). Otherwise, how else could you discern economic growth from a mere rise in prices? Therefore economists “deflate” GDP statistics by the rate of inflation to determine real changes in economic output. Curiously, instead of utilizing the CPI in such calculations, the government utilizes a different price index entitled Personal Consumption Expenditures (PCE). Why? As the PCE index is chronically lower than the CPI, real economic growth appears higher than if the CPI was used. Not content with just this trick, the Bureau of Economic Analysis (there are a number of U.S. agencies that compile economic statistics) rolled out new guidelines for GDP calculation on July 31, 2013: henceforth, expenses paid for research & development will be included to “capture” the benefits of intangible assets. GDP jumped 2.7% with the addition (every little bit helps) and future growth is projected to be higher with the change.

Unemployment –

As of September 2013, unemployment stood at 7.2%, its lowest level since December 2008 (7.3%) which appears an impressive rebound given its peak of 10.0% (October 2009). But the Labor Participation Rate, the statistic that measures the actively employed percentage of an economy’s workforce, stands at a mere 63.2% – a level not observed since 1978. The discrepancy? Literally, millions of discouraged unemployed workers have ceased looking for work. In BLS calculations, if you do not have a job, you are unemployed. But if you have been looking for years and have become so disillusioned as to end your efforts, you are no longer unemployed – but you still do not have a job.

We understand that many areas of the economy cannot be measured with any precision. In fact, the Austrian school of economics, to which we subscribe, was the first to point out the difficulties of measuring something as seemingly innocuous as the price level.

Because of such difficulties, it is reasonable to believe economists seek to improve their accuracy and worth. But when do refinement and improvement become, not a purpose, but a pretense for goosing the numbers? The aforementioned machinations prove we are already there.

However, worse than the manipulation of statistics to placate the populace and the financial markets is the reason the government is so interested in statistics. As explained by the noted economist Murray Rothbard:

Statistics are the eyes and ears of the bureaucrat, the politician, the socialistic reformer. Only by statistics can they know, or at least have any idea about, what is going on in the economy. Only by statistics can they find out . . . who “needs” what throughout the economy, and how much federal money should be channeled in what directions.[2]

Statistics are the critical tools of the central planners. Their growth in usage tracks the retrenchment of free markets from the economic landscape. Their manipulation reflects the deterioration of an economy.

Twain may have been a great author of fiction, but the U.S. government wins the Pulitzer.

Endnotes:

  1. Twain, Mark. Chapters from my Autobiography (Washington, DC: American Enterprise Association, 1960), p. 16.
  2. Statistics: Achilles’ Heel of Government by Murray N. Rothbard[This essay was published in Essays on Liberty, VIII (Irvington-on-Hudson, NY: Foundation for Economic Education, 1961), pp.255-261, and in The Freeman, June 1961,


Commemoration of a Canard

August 13, 2013

Commemoration of a Canard

“I have directed Secretary Connally to suspend temporarily the convertibility of the dollar into gold.” – Richard M. Nixon, August 15, 1971

In the spirit of commemoration, we cannot allow the 42nd anniversary of Nixon’s speech go without comment. Addressing the nation to “outline a new economic policy”, he failed to disappoint: wage and price controls were instituted, the automobile industry was browbeaten into reducing prices, and a 10% tariff was assessed on all imports. All this before Nixon announced his grandest exploit – the termination of U.S. commitments to exchange gold for dollars with foreign governments.

Previously, the Federal Reserve’s ability to issue new money was limited by the threat of depleting the government’s gold reserves. Printing too many dollars led foreign governments to start favoring gold over holding depreciating U.S. dollars. Nixon’s actions (which proved not to be temporary) ended the last vestige of a gold standard, erased all limits on the unchecked printing of money, and effectively ended the world’s currency system (known as Bretton Woods) in place since World War II.

Whether Nixon was sincere in his belief that these actions would truly, to use his terms, “nurture and stimulate” the economy or if – perchance – he knew better and deceived the American people, we have no comment. We reserve our commentary not to purpose, but to effect.

And the effect was an unmitigated disaster. Nixon promised Americans that any talk of inflation with an unconstrained Federal Reserve was a “bugaboo” and that his actions would actually “stabilize the dollar.” (If you wish to listen to Nixon in his own words, the latter part of his speech can be viewed here). According to him, the risk of Americans paying higher prices was extremely limited:

If you want to buy a foreign car or take a trip abroad, market conditions may cause your dollar to buy slightly less. But if you are among the overwhelming majority of Americans who buy American-made products in America, your dollar will be worth just as much tomorrow as it is today.

Despite these assurances, inflation became a hallmark of the 1970’s as the unimpeded Federal Reserve zealously increased the money supply. The year 1973 experienced inflation of 9%, 1974 brought 12%, and the decade was closed out with a peak inflation rate of 14% in 1979. Since the date of Nixon’s speech, the dollar has lost 83% of its value. One dollar then is worth 17 cents today. What will it be worth tomorrow?

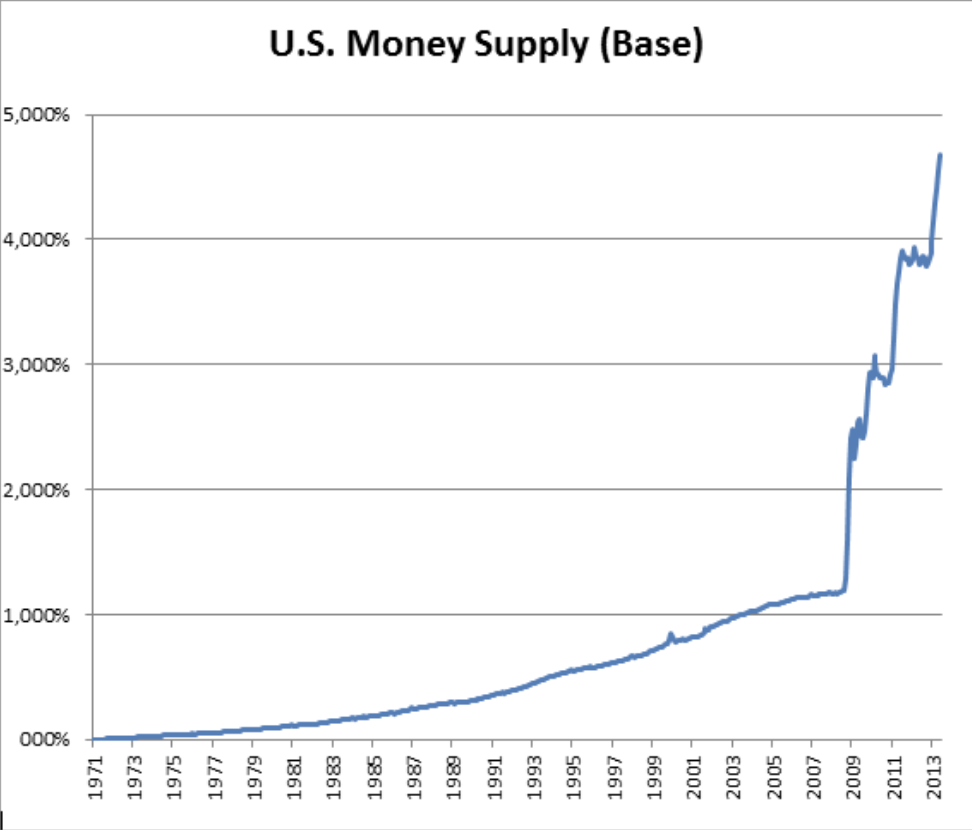
We cannot say with certainty, for while the creation of money causes inflation, the effect does not correspond fully in magnitude. Nor is it immediate. In fact, the lag between the expansion of the money supply and the onset of inflation could be years. If so, what expectations are reasonable based upon the Federal Reserve’s actions since 2008? The scary answer can be found in this chart.

To tweak a famous quote by Winston Churchill, wiping away the last traces of the gold standard was not a new beginning for U.S. monetary policy. It was not even the end of the beginning. But it was, perhaps, the beginning of the end.


The January 2021 Presidential Election Winners: President Pence and Vice President Harris?

October 2020

No, the general election on November 3rd will not be postponed, but the future President of the United States may be elected by a different group of voters on a much later date – and it may happen after the new Congress convenes on or around January 3rd. This election may be as close as it is disputed, and given the complexities and vagaries of election laws, the House of Representatives could very well elect the next President.

Several scenarios provide for this possibility. Since 538 Electoral College votes exist, the winner must secure 270 of them – a majority – to win the election. The 2000 Bush-Gore election illustrates just how close this election may be: Bush won with only 271 votes (to Gore’s 266).

For those adding together that election’s votes, one will notice only 537 Electoral College votes were submitted. One elector (from a state won by Gore) abstained. It is the first time an elector abstained, but not the first time one has refused to vote for the candidate for whom they pledged their vote (an action known as being a “faithless elector”). Absent a third-party candidate, the existence and actions of faithless electors represent one of two possible scenarios by which an election could fail to produce a majority winner.1

The other possibility would be the failure of a state’s votes to be counted since they lack certification. Understanding either scenario requires a review of the Electoral College process as governed by the Constitution and state and federal law.1 2

Before the general election, electors for the Electoral College are chosen by each state for each candidate. Under a typical, two-party election, at least two “slates” of electors exist – each one consisting of electors pledged to vote for a particular party’s candidate. After the election, each state mandates its own processes to verify the integrity and completeness of the election. For example, certain canvassing (similar to auditing) procedures take place. Each state has its own procedures and timelines.3

The problem arises in the fairly short timeline between the general election and the Constitutionally mandated new terms for President and Vice President beginning at noon on January 20th. According to federal law, the electors must meet and cast their ballots (in their respective states) 41 days after the general election (or December 14th for this year). It is these ballots that are sent to Congress for the official tally taking place on January 5th. In order to avoid any controversy about the legitimacy of the votes, a “safe harbor” period exists under federal law: if the slate of electors is certified by the state six days before the electors meet (or December 8th for this year), the slate is considered “conclusive” and will not be disputed in Congress.

If the “safe harbor” timeline is not met, both houses of Congress determine which slate of electors will be recognized from a state. This almost happened in the 2000 election. Many misremember the Supreme Court as “deciding the election” in favor of George Bush. In reality, Florida’s slate of electors pledged to Bush was to be selected (certified by its Secretary of State) when various lawsuits culminated in a Florida Supreme Court ruling to recount the ballots in four counties and all ballots throughout the state which did not select a Presidential candidate (under the assumption this was done in error). Such measures would have been physically impossible before the expiration of the “safe harbor” period, and Congress would have decided the issue (for which the only precedent, the 1876 Tilden-Hayes election, offers little guidance). The U.S. Supreme Court ruled the recount unconstitutional for various reasons and thus allowed Florida to certify its results in time to meet the “safe harbor” provision (actually, on the last possible day). Presumably, if Congress cannot resolve the matter, the electoral votes may simply not be counted (thus preventing a majority winner).

In another scenario, all of the states’ electoral results may be certified, but a faithless elector may not honor the majority vote from their state. There are 33 states (as well as the District of Columbia) that have laws compelling (e.g., via the threat of fines, removal from office, etc.) electors to honor their pledge. These laws were recently upheld as constitutional by the unanimous Supreme Court decision in Chiafolo v. Washington (concerning the 2016 election).4 Therefore, 17 states, including the swing states of Pennsylvania, grant electors the ability to vote their conscience. Other states, including swing states like Ohio, Florida, and Wisconsin, have laws against faithless electors, but still, allow the vote to be counted as cast. While a faithless elector has never impacted an election, a Republican’s discomfort with an “outsider” like Trump or a Democrat’s concern about Biden’s cognitive ability probably heightens the likelihood of wayward votes (or abstentions).5

What happens on January 6th if, according to the official reading of the electors’ votes, neither candidate secures a majority? According to the 20th Amendment to the Constitution, the House of Representatives “immediately” elects the President and the Senate elects the Vice President.

Such a scenario seems to suggest a President Biden and Vice President Pence (assuming the political control of Congress remains the same). But two nuances imply a different, or at least uncertain, outcome.

First, the House does not vote in the same manner as it does with matters of law or procedure (with each Representative casting one vote). Rather, each state casts one vote as determined by a majority of their Representatives. If such a vote was taken today and cast along party lines, Republicans would control the outcome by a vote of 26 to 23 (as Pennsylvania’s Representatives are equally split and Michigan, assuming Libertarian party member Justin Amash does not squash his disdain for President Trump, would vote Democrat – otherwise the vote would be 26 to 22).6

Second, the circumstances dictating this scenario’s result may not exist since the new Congress based upon November’s general election is sworn in on January 3rd. A change to a mere two states could swing the election in the House to Democratic control.

And what if the House of Representatives is deadlocked in a tie? Who becomes President on inauguration day? Vice President Pence would assume the Presidency. As the Senate can only vote for the two Vice Presidential candidates receiving the most votes (Pence and Harris) and since one cannot hold both offices, Kamala Harris would become Vice President by default.

President Pence and Vice President Harris. The acrimonious political landscape of the next four years may supersede that of 2020. Just another risk the financial markets have yet to consider.

Endnotes:

  1. Maskell, Jack and Rybicki, Elizabeth. “Counting Elector Votes: An Overview of Procedures at the Joint Session, Including Objections by Members of Congress” Congressional Research Service. https://crsreports.congress.gov/product/pdf/RL/RL32717/12
  2. Tokaji, Daniel. “An Unsafe Harbor: Recounts, Contest, and the Electoral College” Michigan Law Review First Impressions. Vol. 106, Article 14. https://repository.law.umich.edu/mlr_fi/vol106/iss1/14/
  3. Ballotpedia. “Election Results Certification Dates, 2020” https://ballotpedia.org/Election_results_certification_dates,_2020
  4. Peter B. Chiafalo, Levi Jennet Guerra, and Esther Virginia John, Petitioners v. Washington. Supreme Court of United States. 140 S.Ct. 2316 (2020) https://scholar.google.com/scholar_case?case=12842404716922482514&q=Chiafalo+v.+Washington&hl=en&as_sdt=400006&as_vis=1
  5. FairVote. Faithless Elector State Laws. 7 July 2020. https://www.fairvote.org/faithless_elector_state_laws
  6. Electoral Ventures LLC. 2020 House Election: Party Composition by State https://www.270towin.com/2020-house-election/state-by- state/consensus-2020-house-forecast