Echoes of 1974

Each year brings investors a fresh list of hopes and fears. Often, mainstream financial firms provide guidance that extrapolates linear thinking into the future. We prefer to take a more cyclical view of the world to glean knowledge from patterns in past cycles that rhyme with today. With that in mind, we set our sights back 50 years ago to 1974, just long enough for most investors to have forgotten those events, and the lessons associated with them. There are five key lessons from that period that we believe are relevant to investors today.

Lesson 1: Inflation & Interest Rates – Volatile But Trending Upward
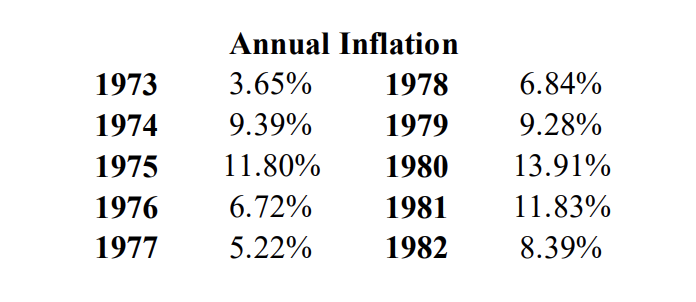
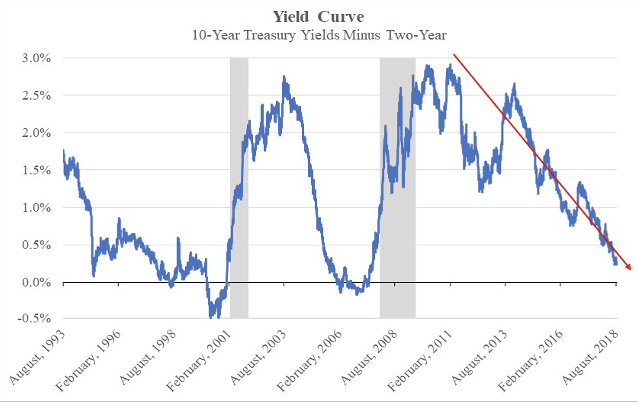
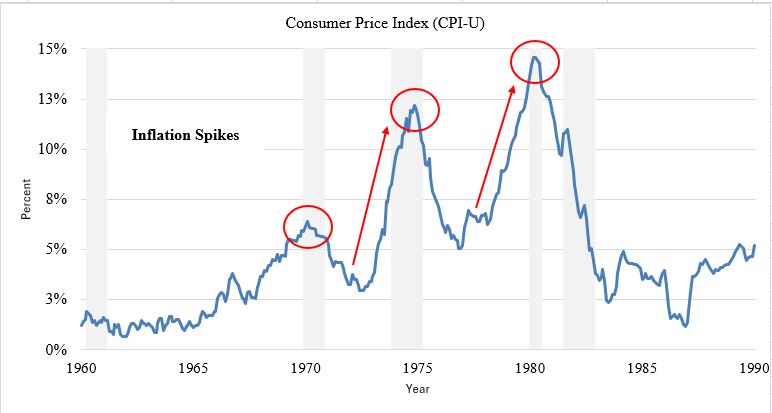
After experiencing renewed inflation in the early 1970’s, 1974 was an inflection point that marked a relative high in annual inflation of 11.1% and interest rates 10.5% (short-term T-bills) and 7.6% (10-year Treasuries). A significant recession hit in 1974 and inflation and interest rates fell. Like today, the consensus was that rising inflation and rising rates were a “blip on the radar” with the worst likely behind us. However, inflation and interest rates aggressively reasserted themselves several years later in a second major upcycle in the late 1970s. Inflation soared to 13.5% at its 1980 peak, pushing interest rates to 16.4% (short-term T-bills) and 13.9% (10-year Treasuries) by 1981.

1

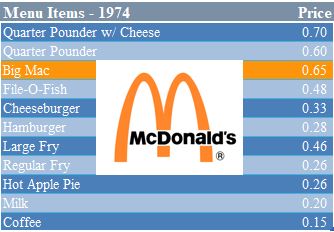
Despite the inflation at the time, a Big Mac at McDonalds was only 65 cents, and it was actually called “Big” for a reason!

2

The Lesson Today:
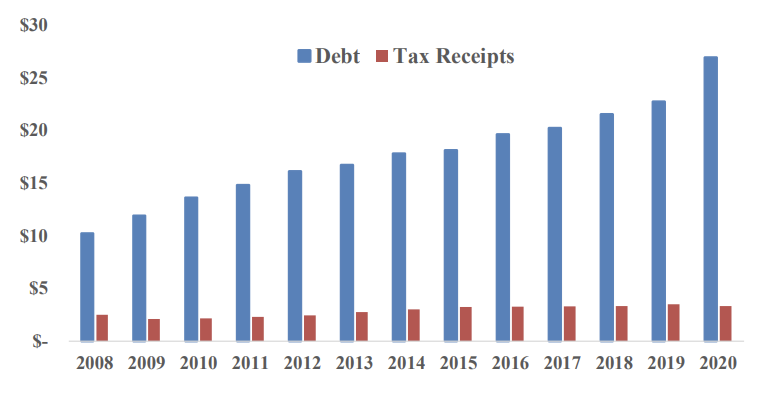
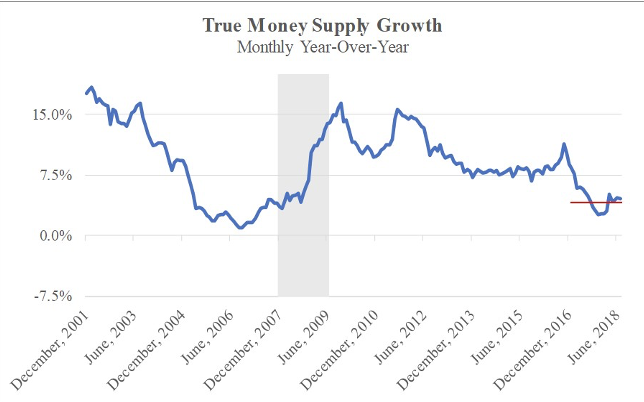
While inflation fell leading into 2024 and 10-year Treasuries remain around 4%, inflation is not dead. It is wise to prepare for a second, bigger wave of rising inflation and interest rates in the coming decade. That said, 2024 may bring a continued temporary lull in inflation and interest rates if global economies weaken. The big caveat for this “lull scenario” is the massive Federal debt levels relative to 1974. The official national debt has surpassed $34 trillion and added a whopping $1 trillion in the last 30 days alone! The question is not who will buy the debt, as there will always be takers at the right price. The question is what interest rate will be demanded by investors.

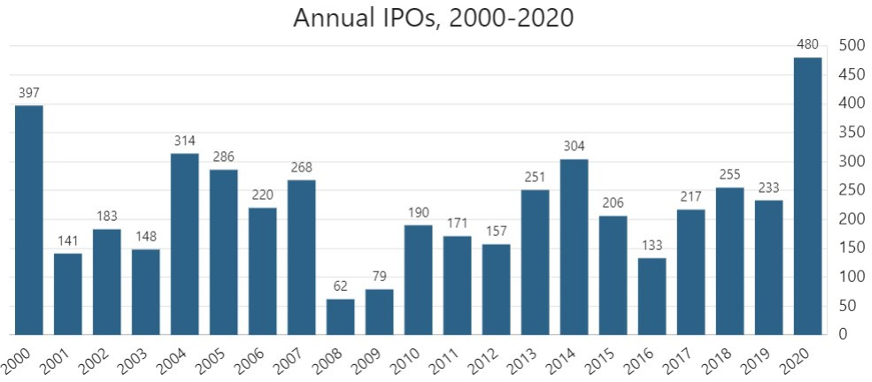
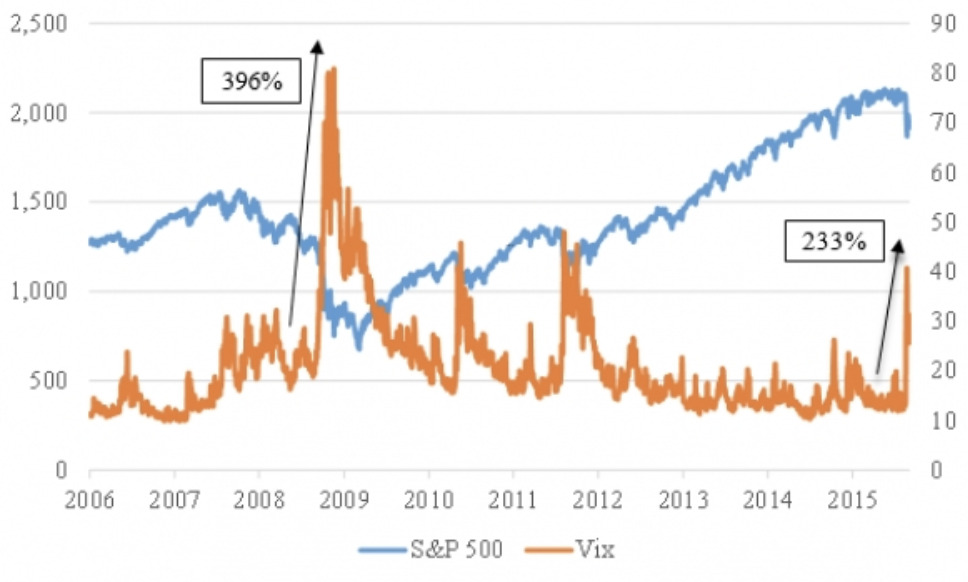
Lesson 2: Extreme Stock Valuation Led to Pain
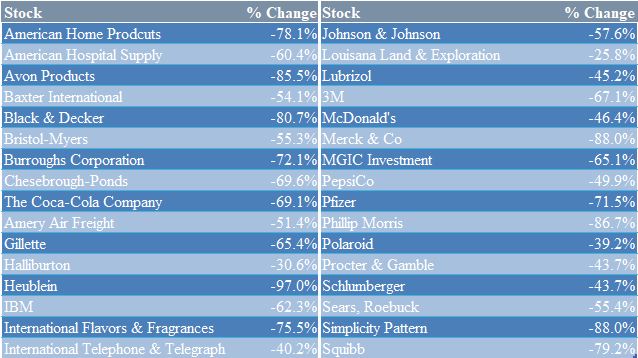
Today’s Magnificent 7 tech stocks have led the S&P500 with extremely narrow stock market leadership.3 Their valuations continue to rival periods such as the 2000 Tech Bubble and the Nifty Fifty from 1974 (a basket of 50 stocks that people believed would lead to outsized returns with a single buy-and-hold proposition). These stocks were the leaders of that era until their ultimate crash into the recession of 1974 when most lost 50% to 80% of their value.

4

The Lesson Today:
When investors fall in love with a narrow group of expensive stocks that have pushed up the stock indices, markets are at risk to greatly disappoint (or crash). Today, the S&P500 has been mainly driven by just seven stocks or approximately 1.4% of total stocks in the index. This suggests the near-term prospects for equities are challenged barring any surprise return to money printing. Although money printing will return, it will take significant pain in the stock markets first for the Fed to justify it.

Lesson 3: Political Instability Rising
President Nixon was the first president to “voluntarily” resign in 1974 amidst the Watergate scandal. This led to an era of distrust and loss of confidence in the government and economy for nearly a decade. Today, the political environment is rife with instability as we enter an election year with a divided country, polarized views, and questions at every level of government.

The Lesson Today:
Politics is a key factor in the confidence of a healthy, functioning capitalistic system. When markets feel at risk and do not trust the institutions or the rules, faith can be lost and not easily recovered.

Lesson 4: War, Energy & the Middle East
The Yom Kippur War between Israel and several Arab nations in the fall of 1973 led to an oil embargo and spike in energy prices. Eerily, another conflict in the Middle East began last year one day removed from the 50th anniversary of this war, sparking many unknown, long-term consequences.

The Lesson Today:
War in the Middle East has many geopolitical implications. It risks dividing countries and causing an unknown future impact on energy markets. Global war, if this were to expand, often goes hand in hand with difficult economic times in history. War has always been a great excuse to tear things up and rebuild them, but not always to benefit of the average citizen.

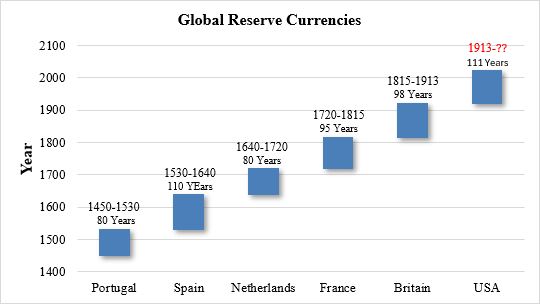
Lesson 5: Changing of the Guard in Currencies Every 100 Years
The early 1970s was a critical time for the U.S. dollar. What had been a pre-World War II system of currencies disciplined by the backing of physical gold or silver morphed into a dollar system under the Bretton Woods Agreement. However, holders of dollars became increasingly nervous in the early 1970s as U.S. spending was seemingly out of control (imagine if they could see things today!) due to social programs and the Vietnam War. The Bretton Woods system promised the dollar could be converted to gold – until it couldn’t. France led the charge to redeem dollars for gold. This resulted in President Nixon’s famous 1971 speech in which he was “temporarily suspending the convertibility of the dollar to gold”. Of course, like most things from the government, temporary programs never go away. From that point forward, the dollar was simply printed out of thin air without constraints.

Today, we are nearing another critical event in the life of the dollar – a rise in nations circumventing the dollar system as seen in the growing alliance of BRICS countries expanding non-dollar denominated trade.5

6

The Lesson Today:
No reserve currency has lasted more than approximately 100 years. Given this, the dollar is late in its life cycle as measured from the 1913 inception of the Federal Reserve system. While the dollar is not on its immediate way out, we envision world trade and capital markets becoming more multi-polar as reliance on the dollar fades. Eventually, the reality must be faced that the U.S. national debt cannot be serviced without creating a death spiral of more money printed just to service debt. Other world currencies face a similar predicament with no likely predecessor. Thus, the world will likely start a gradual, and then sudden path back to sound money (likely precious metals and perhaps cryptocurrencies) – not by choice, but by necessity.

Endnotes:

  1. Board of Governors of the Federal Reserve System (US). “10-Year Treasury Constant Maturity Rate.” FRED,
    Federal Reserve Bank of St. Louis, 2 Jan. 1962, fred.stlouisfed.org/series/DGS10/.
  2. “Vintage McDonald’s Menu from the 70s Reveals How Much Has Changed over the Last 40 Years.” Throwbacks,
    31 Aug. 2023, throwbacks.com/vintage-mcdonalds-menu-from-the-70s-reveals-how-much-has-changed-over-thelast-
    40-years/.
  3. Magnificent 7 stocks: Alphabet, Amazon, Apple, Meta, Microsoft, Nvidia, Tesla
  4. “Revisiting the Nifty Fifty.” Stray Reflections – Revisiting the Nifty Fifty, strayreflections.
    com/article/252/Revisiting_the_Nifty_Fifty.
  5. BRICS: Brazil, Russia, India, China, and South Africa
  6. “World Reserve Currencies: What Happened during Previous Periods of Transition? Economic Reason.”
    www.economicreason.com/usdollarcollapse/world-reserve-currencies-what-happened-during-previous-periods-oftransition/.


What if This Time is Different?

What if This Time is Different?What if, before the world ever heard of coronavirus, every valuation multiple suggested the U.S. stock market was one of the most expensive in history? What if these valuations assumed – and required – continued economic growth, robust increases in company earnings, and sustained and substantial stock buybacks? What if those assumptions were completely wrong?

What if the current stock market rally assumes a “Vshaped” economic recovery with lockdowns ending soon, companies rehiring employees, pharmaceutical companies developing a vaccine, and a quick “return to normalcy”? What if those assumptions are wrong?

What if lockdowns drag out, companies enter bankruptcy en masse, unemployment remains high, and households stop buying? What if retail businesses only reopen with limited capacity? What if retail businesses cannot be profitable at such capacity levels? What if landlords stop receiving rents from tenants and start losing tenants? What if some industries like hospitality and airlines take years to recover? What if even hospitals lose money since elective surgeries are nonexistent? What if even universities bleed red ink as full-tuition paying foreign students don’t return? What if other such industries perceived to be immune from this crisis fail as their most lucrative revenue streams cease to exist?

What if banks refuse to grant forbearance to landlords and companies? What if defaults skyrocket? What if banks are incapable of even understanding the damage to their loan portfolio? What if banks raise lending standards so few qualify for loans? What if banks start charging higher interest rates as they perceive increased risk? What if banks have already increased rates on their variable loans? What if banks simply stop lending? What if banks fail?

What if public pension funds fail and states cannot bail them out? What if cities file for bankruptcy? What if states must sustain prolonged unemployment benefits? What if state governments’ fiscal measures create debt levels which can never be repaid? What if these debt levels increase so much that their interest payments cannot be serviced? What if states go bankrupt?

What if the Federal Government’s own estimates are right, and it borrows almost $4 trillion this year? What if it’s more? What if the U.S. government is already insolvent? What if the lender of last resort really is the last resort? What if printing more green pieces of paper doesn’t solve these issues?

What if a recession actually started before coronavirus had infected anyone? What if an inverted yield curve, a deteriorating Cass Freight Index, and an unprecedented breakdown in the repo market suggest a recession started in late 2019 or was imminent in early 2020?

What if such a recession, rather than being a typical downturn, was one of monumental magnitude – even worse than that of the Great Recession? What if recessions are caused by increases in the money supply which artificially lower interest rates, thereby deceiving individuals and companies into making poor investment decisions? What if the Federal Reserve’s unprecedented (at the time) monetary expansion from the 2008 crisis sowed the seeds of an even greater recession today? What if all of this is happening in addition to the economic damage caused by coronavirus containment measures? What if such a recession was just getting started? What if it lasts for years?

What if a comparison of today’s financial market valuations with deteriorating economic fundamentals suggests this is greatest stock market bubble in all of U.S. history? What if bonds are not safe when money is lent to bankrupt companies and insolvent governments? What if bonds don’t protect an investment portfolio? What if stocks and bonds prove highly correlated – to the downside?

What if, after an initial bout of deflation, inflation kicks into overdrive? What if the 1970s suggest stocks and bonds can lose ground for a decade or more relative to inflation? What if most financial advisors only give lip service to inflation risk to their clients? What if their clients own no precious metals, farmland, rental real estate, or cryptocurrencies to protect them from inflation?

What if mainstream financial advisors were ultimately wrong when they said “This time is different” during the heady bull market years? What if they advise clients never to panic and never to sell? What if it is time to panic? What if it is time to sell?

What if equities crash and it takes years to recover like it has seven times over the last 100 years? What if the stock market collapses and it takes over 20 years to break even as it did after 1929? What if retirement-age workers can no longer afford to retire?

What if this time is not different?

What if most financial advisors are telling clients to buy the dip? What if they are telling investors the markets always rebound and the economy always quickly recovers? What if investors are conditioned to believe them based upon their experience with the 2008 crisis?

What if this time is different?

About WindRock

WindRock Wealth Management is an independent investment management firm founded on the belief that investment success in today’s increasingly uncertain world requires a focus on the macroeconomic “big picture” combined with an entrepreneurial mindset to seize on unique investment opportunities. We serve as the trusted voice to a select group of high-net-worth individuals, family offices, foundations, and retirement plans.

All content and matters discussed are for information purposes only. Opinions expressed are solely those of WindRock WealthManagement LLC and our staff. The material presented is believed to be from reliable sources; however, we make no representations as to its accuracy or completeness. All information and ideas presented do not constitute investment advice and investors should discuss any ideas with their registered investment advisor. Fee-based investment advisory services are offered by WindRock Wealth Management LLC, an SEC-Registered Investment Advisor. The presence of the information contained herein shall in no way be construed or interpreted as a solicitation to sell or offer to sell investment advisory services. WindRock Wealth Management may have a material interest in some or all of the investment topics discussed. Nothing should be interpreted to state or imply that past results are an indication of future performance. There are no warranties, expresses or implied, as to accuracy, completeness, or results obtained from any information contained herein. You may not modify this content for any other purposes without express written consent.


When Euphoria Turns to Phoria

January 2021

Financial market tops always exhibit elevated valuations (check) typically combined with weak or deteriorating economic conditions (check) and a backdrop of investor complacency (check). But the greatest bubbles exhibit far more than such excess; they exude exuberance. Are the financial markets in a current state of euphoria with a commensurate risk of a market downturn? Various metrics strongly indicate as such.

Citi provides their own proprietary index: the Citi Panic / Euphoria Model. This index utilizes multiple sentiment and trading indications to assess investor mentality. “Euphoric” measures exceed 0.41 on their scale. The market rarely reaches such levels: over the last 20 years, it breached this level only five times. Three of those were but brief touches before receding in quick order.

But two times, the market was solidly deep within the “euphoric” area of the index: 1999 to 2000 and 2020 to 2021. At the height of the technology bubble, the index neared 1.50. What does the index indicate today? In January 2021, the index sits solidly at 1.80 having gone hyperbolic over the last several months.1

Another commonly accepted signal of extreme bullish sentiment is the increased acceptance of and demand for riskier assets; for example, initial public offerings (“IPOs”). During such times, companies oblige by increasing the number of IPOs to avail themselves of such demand in raising capital. The following chart demonstrates the number of IPOs in 2020 exceeded even that of the technology bubble.2

Curiously, of the 480 IPOs in 2020, fully 248 of them were Special Purpose Acquisition Companies (SPACs).3 A SPAC is often called a “blank check” shell corporation because it pools investor funds together to finance an unknown acquisition within a future timeframe (generally two years).4 Investing in a SPAC is like paying to sit at the chef’s table in an unknown restaurant with an unnamed chef at some point in the future. Even the most fervent foodies would choke on the idea.

But not investors – not only were 248 SPACs debuted in 2020, but already to date in 2021, another 59 launched which tied the previous, pre- 2020 high set in 2019. And prior to 2019, SPACs averaged less than 17 per year during the previous ten-year period (2009 to 2018).5 If the Citi Panic / Euphoria Model seeks corroboration, IPOs and SPACs provide it.

While “euphoria” is a state of intense excitement and happiness, “phoria” is a misalignment of the eyes which breaks binocular vision. Investors are moving from euphoria to phoria: unable to focus on sound investment principles and blind to economic dangers.

As long the Federal Reserve continues aggressive monetary expansion, investors may continue to fuel financial markets to loftier valuations and higher euphoria. However, many variables could work to undermine or overwhelm the Federal Reserve’s efforts. If that happens, investor sentiment and demand may plummet, for their feelings are usually fickle. Financial markets will move accordingly.

Endnotes:

  1. “A $13 Trillion Crisis-Era Debt Bill Comes Due for Big Economies” Bloomberg News. 04 January 2021
  2. Citi Research.
  3. Stock Analysis. 20 January 2021 https://stockanalysis.com/ipos/statistics/
  4. Special-purpose acquisition company 20 January 2021 https://en.wikipedia.org/wiki/Special-purpose_acquisition_company
  5. SPACInsider. 20 January 2021 https://spacinsider.com/stats/
  6. Ibid.


And the Election Winner is … Inflation in a Landslide!

Christopher P. Casey

Regardless as to which candidate secures the Presidency on November 3rd (or some subsequent date), the administration must cope with unprecedented federal debt. This debt will only increase for the foreseeable future with record-breaking federal deficits caused by mounting pandemic relief and stimulus spending along with diminished tax revenues. The only available “solution” for the U.S. government to finance such debt and deficits will be through continued massive money printing which will inevitably lead to price inflation. How can investors protect themselves?

What Does and Does Not Cause Inflation?

Due to the widespread misunderstanding of what causes inflation, it first warrants a discussion as to what does not cause inflation. In particular, three inflation fallacies are often cited by mainstream financial pundits and Keynesian economists.

First, the “cost-push” theory of inflation states that price increases in certain commodities force the prices of all goods and services higher. The 1970s are often cited as an example: as increased oil prices permeated the economy, prices for fuel, plastics, and other oil-derived products would increase as well.

But as the price of oil or some other cost-push culprit rises, buyers have less money to spend on other goods and services. Having less money to purchase something else means less demand exists for that other product, and decreased demand reduces prices. So, while some prices may go up, it is ultimately at the expense of other prices which go down. Accordingly, no direct net effect to the overall price level is created by these price changes.

The second inflation misconception is the “demand-pull” theory. Keynesian economic theory believes inflation also materializes when aggregate demand for goods and services exceeds aggregate supply when the economy is at full employment and capacity (which also incorrectly assumes such “aggregates” can diverge from each other). When the economy is at full employment and capacity, increased aggregate demand forces producers of goods and services (soon to be followed by their suppliers) to increase prices. Here lies the origin of the belief in inflation from an “overheated” economy. According to this theory, inflation cannot develop during periods of weak economic growth. But the 1970’s American economy (as well as numerous other economic periods in history – see modern-day Venezuela) clearly disprove this.

Finally, many incorrectly believe inflation cannot develop until the “velocity” of money increases. Typically defined as “the number of times one dollar is spent to buy goods and services per unit of time,” monetary velocity theory originates from the so-called Fisher Equation of Exchange: MV=PT (where the quantity of money [M] times the velocity of its circulation [V] equals prices [P] multiplied by their related transactions [T]). But why would such a formula explain the general price level?

Almost all economists today recognize that the price for any particular good or service derives from the interaction of supply and demand. The “price” of money derives from the same supply and demand dynamic as any good or service. The word “price” in terms of money, to avoid confusion, can be thought of as “value”. If the demand for money increases, its value increases and the prices of all goods and services fall (deflation). If the supply of money increases, its value decreases and the prices of all goods and services rise (inflation). Inflation is simply caused by an increase in the money supply and/or a reduction in the demand for money.

Velocity is not a substitute for demand, but rather of volume. Lots of goods and services may transact at low prices just as they may trade at high prices. In either scenario, “velocity” is high while the demand for money may be low or high. Since velocity is not a substitute for demand, it cannot help explain inflation.

How Does the Federal Debt Situation Affect Inflation?

Federal debt can be deleterious for many reasons. Among other things, it crowds out private investment (by bidding up the price of capital) and must be repaid by taxpayers (in one form or another). The repayment must derive from future taxes or by printing new money to satisfy debt service.

As this chart demonstrates, the U.S. government can never repay its debt based upon tax receipts (nor do politicians have any intention of doing so) (in trillions):1

As of September 30, 2020, the federal debt stood at over eight times estimated 2020 fiscal year tax receipts.2

It would take that many years to repay all debt assuming the federal government ceased all spending. Paying back the federal debt through future budget surpluses is unrealistic. And the situation is getting worse.

The Congressional Budget Office, itself always opportunistic about government finances, recently stated “the deficit in 2021 is projected to be 8.6 percent of GDP.”  And that “between 1946 and 2019, the deficit as a share of GDP has been larger than that only twice”.3

The only means by which the U.S. government can service its debt, let alone its future debt, is through continued, massive monetary expansion. And the Federal Reserve has already started in record-breaking fashion:4

Why Should Investors be Concerned?

Many U.S. investors have little memory of the 1970’s inflation and thus not only discount the likelihood of inflation, but are largely ignorant as to its negative impact. It bears remembering that the price level did in fact more than double (121% increase) in approximately ten years (from 1973 to 1982).5

The implications for traditional stock and bond portfolios can be devastating. For example, in real terms, a 60%/40% stock/bond portfolio from 1973 to 1982 returned an annual rate of less than 1% (when calculated using the Wilshire 5000 Total Market Index as a proxy for equities and the ICE Bank of America U.S. Corporate Index Total Return Index Value to represent bonds).6

Bonds were especially impacted, losing just over 4% per annum which disproportionately affected retirees, those approaching retirement, and any “conservative” investors.

The 1970s demonstrate that, at least in regards to inflation, stocks and bonds may not provide significant diversification to each other.

What can Investors do to Protect Themselves from Inflation?

Inflation-protection hedges fall into three categories. First, and perhaps most obvious, alternative currencies which are not experiencing the same inflationary pressures. For many years, foreign currencies such as the Swiss franc qualified (until the Swiss National Bank embarked on the same reckless monetary expansion as the world’s other major central banks). But precious metals and cryptocurrencies provide even better protection.

Second, any businesses which have costs in an inflationary currency with revenues tied to a stable (or at least less inflationary) currency profit from the currency valuation discrepancies, and should appreciate dramatically. Primarily, this involves commodity producers such as farmland or energy companies. Some potential examples would be American farmland in the 1970s (and in the future), Brazilian farmland today, or Russian energy companies during any ruble crisis.

Finally, assets utilizing extensive financial leverage (especially with long-term fixed rates) should also perform well. Since inflation helps borrowers to the detriment of lenders (since the money repaid is worth less than when lent), industries with large debt levels such as real estate benefit (especially if they have short- term leases with tenants that renew at the new, inflationary rents). Additionally, as inflation may increase interest rates which deters or limits future borrowing, such industries may experience less future competition, all things being equal.

But the marketplace already knows about these traditional inflation hedge categories. The time to act is before the prices of inflation-protection assets are bid up once inflation appears.

About WindRock

WindRock Wealth Management is an independent investment management firm founded on the belief that investment success in today’s increasingly uncertain world requires a focus on the macroeconomic “big picture” combined with an entrepreneurial mindset to seize on unique investment opportunities. We serve as the trusted voice to a select group of high-net-worth individuals, family offices, foundations and retirement plans.

www.windrockwealth.com

312-650-9822

assistant@windrockwealth.com

Endnotes:

  1. Federal Reserve Board of St. Louis https://fred.stlouisfed.org/
  2. US Debt Clock.org https://www.usdebtclock.org/
  3. “An Update to the Budget Outlook: 2020 to 2030” Congress of the United States Congressional Budget Office. September 2020
  4. Federal Reserve Board of St. Louis https://fred.stlouisfed.org/
  5. Ibid.
  6. Ibid.


Winter is Coming

This article was originally published by the Mises Institute on August 29, 2018

Fans of HBO’s hit series, Game of Thrones, know well the motto of House Stark: “Winter is Coming.” This motto warns of impending doom, whether brought on by the Starks themselves, devastating multi-year, cold weather, or something far more ominous north of the Wall.

At least since Soviet economist Nikolai Kondratieff wrote The Major Economic Cycles in 1925, recessions have been associated with winter weather.1 Although Kondratieff’s theories contained as much fantasy as Game of Thrones, using seasons as an analogy for the stages of a business cycle is intuitive. If spring represents recovery, and summer the peak of economic growth, then the U.S. economy may well be in autumn. All should be as wary as the subjects of Westeros (the realm of focus in Game of Thrones).

Why Winter is Coming

Few mainstream economists currently foresee a recession. They cite “strong” (a new-found, favorite term in Federal Open Market Committee minutes) economic statistics, a “healthy” stock market (despite gains highly concentrated in the so-called “FANG” stocks), and few warning signs among the “leading indicators.”2 3 But the same exact sentiment existed before the last recession. Most infamously, then-Federal Reserve Chairman Ben Bernanke stated in January 2008 – exactly one month after the recession technically began: “the Federal Reserve is not currently forecasting a recession.”4

How could Chairman Bernanke have been so wrong then, and why may mainstream economists be likewise wrong today? The answer lies in their erroneous business cycle theories. Without a theory which accurately describes recessions, watching leading indicators or other signs of a slowdown are as effective as reading tea leaves. One can only predict by first understanding causality.

The Austrian school of economics explains business cycles, for it describes their phenomena (e.g., the “cluster of error” exhibited by businesses and economic actors), why they are recurring, and why they first repeatedly appeared in the 19th century (with fractional-reserve banking and/or central banks). In short, when the money supply is artificially increased, interest rates are decreased and distorted. As interest rates are a universal market signal to all businesses and economic actors, investments and purchases which previously appeared unprofitable or untenable now seem economically profitable or reasonable.

However, these expenditures are actually “malinvested” relative to the natural level of interest rates. When interest rates revert to their natural level and structure, a recession ensues. Recessions are an inevitable condition which corrects malinvestments by returning capital to rightful purpose.

What causes the artificial boom to end and the winter to begin? Ludwig von Mises offered a succinct explanation:

The boom can last only as long as the credit expansion progresses at an ever-accelerated pace. The boom comes to an end as soon as additional quantities of fiduciary media are no longer thrown upon the loan market.5

In the U.S., the growth rate of “additional quantities of fiduciary media” has flatlined (as represented by the red line below). The most relevant monetary metric to analyze is the Austrian definition of the money supply known as “True Money Supply” (“TMS”). Developed by Murray Rothbard and Joseph Salerno (and frequently commented upon by Ryan McMaken of the Mises Institute), TMS more accurately captures Federal Reserve activity than traditional measures such as M2. Since March 2017, it has averaged a mere expansion rate of just over 4%.6

Since Austrian business cycle theory describes the impact of monetary expansion and contraction upon interest rates which, in turn, impacts the economy, are interest rates likewise signaling a possible end to the current, artificial economic expansion?

When Winter is Coming

Interest rates have certainly risen. Since breaking below 1.4% just over two years ago, the 10-year Treasury has traded with a yield close to 3.0% for the majority of 2018.7 But in forecasting a recession, timing and probability are better served by analyzing the structure of interest rates (known as the yield currve) rather than the overall interest rate level.

The yield curve represents a graphical depiction of fixed-interest rate security yields plotted against the amount of time until their maturity. Various methods of measuring the “flatness” of the yield curve exist, but one of the most popular is the yield on a long-dated bond (e.g., the 10-year Treasury) minus the yield on a shorter-term bond (e.g., the 2-year Treasury). Based on this methodology, the yield curve has flattened extensively over the last several years to levels last observed just prior to the Great Recession.

Historically, a yield curve which flattens enough to become inverted; that is, when short-term interest rates are higher than longer-term interest rates, a recession typically follows. An inverted yield curve possesses a unique power of predictability.

As explained by economist Robert Murphy, in foreshadowing every recession since 1950:

Not only has there only been one false positive (which even here was still associated with a slowdown), but every actual recession in this timeframe has had an inverted (or nearly inverted) yield curve precede it. In other words, there are no false negatives either when it comes to the yield curve’s predictive powers in the postwar period.7

The acknowledgement of the yield curve’s prognosticative capability extends beyond Austrian school economists such as Dr. Murphy, for numerous studies – many by Federal Reserve economists – cite this phenomenon. The Federal Reserve Bank of New York, in introducing some of this research, recognizes “the empirical regularity that the slope of the yield curve is a reliable predictor of future real economic activity.”8

Recognition is different from understanding as mainstream economists are largely unable to offer an explanation. However, yield curve recession signals adhere well to Austrian business cycle theory which demonstrates the importance of banks in creating money and lowering interest rates (which steepens the yield curve as most of their influence resides with shorter maturities). It is the reversal of money creation – and the impact of banks on interest rates – which causes shorter-term interest rates to rise disproportionately (the typical fashion by which the yield curve flattens).

In addition, if the artificial boom ends when interest rates are no longer artificially depressed, then it stands to reason the structure of interest rates will also revert to its natural state. A flatter yield curve comports with the natural structure of interest rates expected in a free market. The Austrian-economist Jesús Huerta de Soto described the underlying reason free markets generate flatter yield curves:

. . . the market rate of interest tends to be the same throughout the entire time market or productive structure in society, not only intratemporally, i.e., in different areas of the market, but also intertemporally . . . the entrepreneurial force itself, drive by a desire for profit, will lead people to disinvest in stages in which the interest rate . . . is lower, relatively speaking, and to invest in stages in which the expected interest rate . . . is higher.9

In short, the predictive power of the yield curve is matched only by the explanatory power of Austrian business cycle theory. If it continues to flatten and invert, a recession will likely follow as the previously created malinvestments are exposed.

But rather than wholeheartedly embrace yield curve analysis, high-ranking Federal Reserve officials consistently waffle at its utilization. Like Westerosi maesters in conclave to determine the advent of winter, they frequently recognize recessions only after their onset.10

Conclusion

The similarities between the climate in Game of Thrones and the state of the U.S. economy are eerily similar. Prior to the recent beginning of winter, Westeros experienced an unusually long time since the last winter. Likewise, according to the National Bureau of Economic Research, the current U.S. expansion is the second longest ever at just over nine years (110 months).11

Also, just as recessions are not phenomena endogenous to free markets (but rather, as discussed above, caused by an artificial expansion of the money supply typically produced/coordinated by central banks), so too the winters in Westeros appear to be generated from an artificial, exogeneous source. As protagonist John Snow explained in describing the supernatural White Walkers: “the true enemy won’t wait out the storm. He brings the storm.” The Night King is the Westerosi version of the Chairman of the Federal Reserve (with the primary difference being the Night King purposely brings about winter).

Finally, like the next winter in Westeros, the next U.S. recession may prove unusually severe by historical standards. In Game of Thrones, many characters (at least the peasants) believe this winter will be the worst in 1,000 years. Given the Federal Reserve’s unprecedented monetary machinations since 2008, the next recession may well prove worse than the last one, and potentially as devastating as the Long Night.

Approximately one year ago, speaking as confidently as a Red Priestess of R’hllor, then-Federal Reserve Chair Janet Yellen believed the next recession-driven financial crisis may be averted for at least a generation or so:

Would I say there will never, ever be another financial crisis? . . . Probably that would be going too far. But I do think we’re much safer . . . and I hope that it will not be in our lifetimes, and I don’t believe it will be [emphasis added].12

You know nothing, Janet Yellen. Winter is coming.

About the Author: Christopher P. Casey is a Managing Director with WindRock Wealth Management. Mr. Casey advises clients on their investment portfolios in today’s world of significant economic and financial intervention. He can be reached at 312-650- 9602 or chris.casey@windrockwealth.com.

WindRock Wealth Management is an independent investment management firm founded on the belief that investment success in today’s increasingly uncertain world requires a focus on the macroeconomic “big picture” combined with an entrepreneurial mindset to seize on unique investment opportunities. We serve as the trusted voice to a select group of high net worth individuals, family offices, foundations and retirement plans.

All content and matters discussed are for information purposes only. Opinions expressed are solely those of WindRock Wealth Management LLC and our staff. Material presented is believed to be from reliable sources; however, we make no representations as to its accuracy or completeness. All information and ideas should be discussed in detail with your individual adviser prior to implementation. Fee-based investment advisory services are offered by WindRock Wealth Management LLC, an SEC-Registered Investment Advisor. The presence of the information contained herein shall in no way be construed or interpreted as a solicitation to sell or offer to sell investment advisory services except, where applicable, in states where we are registered or where an exemption or exclusion from such registration exists. WindRock Wealth Management may have a material interest in some or all of the investment topics discussed. Nothing should be interpreted to state or imply that past results are an indication of future performance. There are no warranties, expresses or implied, as to accuracy, completeness or results obtained from any information contained herein. You may not modify this content for any other purposes without express written consent.


What Stops the Stock Market Rally?

August, 2020

In terms of magnitude and shortness of time, the stock market rally since its March lows has been unparalleled. Yet it is especially notable given negative economic reality (an annualized second quarter GDP plunge of 32.9%) and diminished company earnings (S&P500 earnings down 50%).1 Will this rally continue? If not, what stops the stock market rally?

Numerous threats exist: continued economic deterioration (a case can be made a recession hit before the lockdowns) and bankruptcies, trade and geopolitical strife with China, civil unrest and mass unemployment, renewed lockdowns due to a Covid resurgence, the loss of hope for a timely vaccine, and a negative economic viewpoint of a very possible Biden presidency.

Either mitigating or masking these risks stands the Federal Reserve’s unprecedented actions since March. Although it intervened with numerous programs and purchased a multitude of assets, its actions can be neatly summarized as having massively increased the money supply. Measured in M2 (a commonly cited definition of money) year-over-year growth since the end of the last recession, the money supply has exploded.

Monetary expansion is singularly responsible for the stock market rally. As such, to ask what stops the stock market rally is to question what stops the Federal Reserve.

Chairman Powell is unlikely to voluntarily withdraw monetary stimuli. He learned that lesson (it is no coincidence that the late 2018 stock market decline occurred after a long-term slowdown in monetary growth).

So short of this development, what external factors may prevent the Federal Reserve from pursuing its current monetary course? Theoretically, why is it that central banks cannot forever increasingly print money to ensure ever higher equity prices?

Murray Rothbard, the Austrian school economist and monetary expert, addressed this issue:3

. . . the boom is kept on its way and ahead of its inevitable comeuppance, by repeated doses of the stimulant of bank credit. It is only when the bank credit expansion must finally stop, either because the banks are getting into a shaky condition or because the public begins to balk at the continuing inflation, that retribution finally catches up with the boom. As soon as the credit expansion stops, then the piper must be paid . . .

The “shaky condition” of banks may derive from low absolute interest rate spreads and unsustainable financial leverage alongside increasing bad loans. It will develop with sustained negative real rates (as it has in other parts of the world).

Assuming a banking crisis is averted, what about inflation? Few under 50-years old can remember, let alone experienced, an inflationary environment as a consumer, but could one be starting now? According to the August 14th issue of Barron’s magazine:4

A trifecta of inflation numbers came in hotter than expected this past week, with consumer prices, producer prices, and import prices for July all rising at faster paces than economists anticipated. Notably, consumer prices – excluding the more volatile food and energy categories – rose at the quickest clip since 1991.

It may not be starting now, but it could be. And unlike the 1970’s, the Federal Reserve will be unable to deflect blame at greedy business owners or higher oil prices. What they once could play off as coincidence will now reek of causality. And if they stop inflating, then any rally could turn to rout.

Endnotes:

  1. S&P500 Down Jones (95% of companies reporting)
  2. Federal Reserve Bank of St. Louis
  3. Rothbard, Murray N. Economic Depressions: Their Cause & Cure. Ludwig von Mises Institute. 2009.
  4. ‘Stagflation’ Looms Over This Market. Why Some Analysts are Worried. Bellfuss, Lisa. Barron’s. 14 August 2020


The Kitchen Sink

April, 2020

By late January, the die was cast: the virus had a name, it had reached our shores, travel screenings and restrictions were in place, and while not yet declared a pandemic, the World Health Organization declared COVID-19 a “Public Health Emergency of International Concern.”

Yet complacency reigned within financial markets. The stock market continued its march to new highs (reached on February 19th). The Federal Reserve, in its January 29th press release, failed to mention coronavirus in the list of variables it “will continue to monitor” save for a generic nod to “global developments.”[i] It began the missive by mentioning recent data “indicates that the labor market remains strong and that economic activity has been rising at a moderate rate.” Famous last words.

It was not until a full month later, and only after the U.S. stock market suffered its worst week since the Great Recession, did the Federal Reserve act. It was rather weak work. On February 29th they issued a statement describing how they were “closely monitoring . . . the evolving risks of the coronavirus to economic activity.”[ii] On March 3rd, they cut interest rates by a not uncommon 50 basis points.

But on March 15th, the Federal Reserve completed its year-to-date journey from satisfaction to concern to sheer panic. That Sunday’s emergency announcement marked the first of several major measures meant to stop the bleeding on Wall Street and stem the tide of anticipated economic hardship.

The Federal Reserve’s actions are unprecedented in both magnitude and breadth and will generate serious repercussions for investors down the road.

While the financial media widely reported how the March 15th actions lowered the federal funds target rate to 0.00-0.25%, it missed the far more drastic action of eliminating bank reserve requirements. Previously, banks had to retain 10% of demand deposits which meant they could theoretically increase the money supply by ten times. Now no limit exists to their monetary expansion.

March 23rd brought more unprecedented action when the Federal Reserve announced it was buying $375 billion in Treasuries and $250 billion in mortgage backed securities that week. For comparison, 2008’s QE1 was $700 billion (comparable in size) and it took months to deploy. It also announced it would continue buying assets “in the amounts needed” to support the economy. It started buying, for the first time ever, corporate and short-term municipal bonds.

Then, on April 9th, the Federal Reserve announced $2.3 trillion in loans to “support the economy.” Not content with corporate and municipal, it started buying junk bonds. It could have saved itself the trouble of buying various bond sectors by simply writing a check for most of the office real estate ($2.5 trillion), farmland ($2.7 trillion), or multi-family housing property ($2.9 trillion) in the U.S.

The Federal Reserve’s substantial and sustained efforts to pull the economy out of the 2008 Great Recession increased its balance sheet by $3.6 trillion in just over six years. It just added $2.3 trillion to its balance sheet in a month.[iii] This isn’t throwing the kitchen sink at a problem – it’s lobbing in the entire kitchen.

Even if the Federal Reserve stopped further actions and ceased its announced programs, its balance sheet will continue to swell as it finances proliferate spending by the U.S. Treasury. Given such actions as the CARES Act and its Paycheck Protection Program, the Congressional Budget Office estimates the 2020 deficit will reach $3.7 trillion – a multiple of anything seen in the wake of the 2008 Great Recession.[iv] This estimate will only increase with any additional spending initiatives by Congress.

Money supply has already exploded and is at the fastest rate in 92 months.[v] It is just getting started.

In response to 2008, the Federal Reserve increased the money supply dramatically, but much of that was held by commercial banks in excess reserves at the Federal Reserve where they earned some small, yet risk-free, interest. This time is different. Not just in magnitude, but in breadth, which is to say by recipient. No longer will money be injected into banks and primary dealers, but to companies and individuals who make up the economy as whole.

Inflation will ensue. Not right away, for the deflationary forces of loan repayments and defaults will counteract and potentially overwhelm inflationary forces. But that will be somewhat temporary.

Until then, it is an opportune time to build up inflation protections for an investment portfolio: certain types of real estate (e.g., farmland and some residential rental property), precious metals, and cryptocurrencies.

Endnotes:

  1. Federal Reserve Bank of St. Louis. Timeline of Events Related to the COVID-19 Pandemic. https://fraser.stlouisfed.org/timeline/covid-19-pandemic#14
  2. Federal Reserve Press Release. 29 Jan 2020. https://fraser.stlouisfed.org/title/federal-open-market-committee-meeting-minutes-transcripts-documents-677/meeting- january-28-29-2020-585165/content/pdf/monetary20200129a1
  3. Federal Reserve Bank of St. Louis. Federal Reserve Total Assets. https://fred.stlouisfed.org/series/WALCL
  4. “Coronavirus Relief Pushing U.S. Deficits to Staggering Heights” Associated Press. https://www.pbs.org/newshour/politics/cbo-says-deficit-to-reach-3-7-trillion-in- economic-decline
  5. “Money Supply Growth Surges to 92-Month High” McMaken, Ryan. Mises Institute. https://mises.org/wire/money-supply-growth-surges-92-month-high


The Tariffying Prospect of a Trade War

July, 2018

David Letterman, Oprah Winfrey, Phil Donahue, and Larry King – future President Donald Trump hit the talk show circuit extensively in the 1980’s and 1990’s. These interviews provide an insightful look into his core beliefs. Consistently, the most passionate commentary concerned foreign nations “taking advantage” of the U.S. – either by failing to contribute more to their own national defense or by running significant trade surpluses (U.S. trade deficits). In these interviews, the latter of which was usually directed (given the time period) at Japan. Today it is China.

Some argue that President Trump is actually in favor of free trade but wishes to renegotiate various trade treaties. That is, by embracing protectionist policies, free trade can be broadened on more “appropriate” terms. For example, some of the stated NAFTA renegotiation objectives include the elimination of “unfair subsidies, market-distorting practices by state-owned enterprises, and burdensome restrictions on intellectual property.”1 Perhaps this is indeed President Trump’s ultimate goal, but this interpretation is contrary to significant evidence in addition to his own talk show confessions.

First, protectionism is theoretically consistent with President Trump’s immigration position. If one believes immigrants take away American jobs, then logically one would also fear cheaper foreign goods which destroy the profitability of American companies – and by extension, cost U.S. workers their jobs.

Second, the protectionist measures enacted so far have been consistently indiscriminate in affecting both allies (e.g., Canada, Europe, etc.) and potential foes (e.g., China) – and thus almost all trade agreements – alike.

Third, President Trump, almost immediately upon taking office, pulled out of the Trans-Pacific Partnership. While one could easily argue this agreement actually hindered free trade given its excessively burdensome and complex rules and regulations, the rationale given for withdrawing was a protectionist argument: the preservation of American manufacturing.

Fourth, he has surrounded himself with advisors notorious for their protectionist policy advocacy. Most notable among them is economist Peter Navarro who authored the book Death by China.

If President Trump truly believes in protectionism, and if such advocacy largely helped him win the election, then we should expect this trade war to continue, broaden, and deepen. It likely would have begun last year but for the need to secure China’s cooperation in dealing with North Korea. As evidence, note that the first major tariffs (March 1st) were issued just after U.S.-North Korean relations started thawing with Kim Yo Jong’s (sister of Chairman Kim Jong Un and special emissary) overtures at the Winter Olympics (which ended on February 25th).

If the trade war escalates, can it directly cause a U.S economic recession? Many mainstream pundits, citing the infamous Smoot-Hawley Act of 1930, warn as such (which is odd, especially since the Great Depression was well underway before it was enacted let alone took effect).

It is rising interest rates which directly cause recessions as the origin of recessions lies in the preceding, artificial boom. When a central bank increases the supply of money, interest rates are artificially lowered. Since interest rates are a universal market signal to all businesses, investments which previously appeared unprofitable now make economic sense. However, the attractiveness of these projects is a mirage. These borrowed funds are actually being “malinvested” given the “true” level of interest rates absent the artificial stimulus. When interest rates eventually rise as monetary stimulus is lessened, the disruptive liquidation of the malinvestments in the ensuing downturn is known as a recession.

But tariffs may indirectly cause a recession. Currently, U.S. Treasury debt held by “Foreign and International Investors” is almost $6.3 trillion. China alone accounts for almost $1.2 trillion and may not be interested in more.2 In May of this year, it was reported that China had halted its purchases of U.S. Treasuries.3

If foreign demand, led by China, for U.S. Treasuries cools (let alone if China liquidates its holdings); expect higher U.S. interest rates (all things being equal). If this, combined with the Federal Reserve’s planned liquidation of bond holdings in the face of increased U.S. budget deficits, develops, interest rates may rise significantly. A recession and financial market distress would surely follow. It is a tariffying prospect.

Endnotes:

  1. “USTR Releases NAFTA Negotiating Objectives” Office of the United States Trade Representative. July 2017.
  2. “Federal Debt Held by Foreign and International Investors. Federal Reserve Bank of St. Louis. https://fred.stlouisfed.org
  3. “We Understand the Chinese Government has Halted Purchases of U.S. Treasuries” ZeroHedge. 4 April 2018.


Irrational Complacency

March, 2017

complacency (noun): a feeling of quiet pleasure or security, often while unaware of some potential danger, defect, or the like.

The financial markets feel complacent. Time and time again, stock market investors merely shrug at adverse financial, economic, and political news. Even the Federal Reserve’s rate hike on March 15th failed to elicit a negative reaction. And the statistics support the anecdotes.

Financial markets typically equate risk with volatility. The greater the volatility generated by stock prices, the greater the risk of the stock market. The most common measure of risk is the Chicago Board Options Exchange (CBOE) Volatility Index, also known as the VIX. Constructed from the implied volatilities of a wide range of S&P 500 index options, it purports to measure expectations about near-term (30-day) volatility.

If high VIX levels indicate fear within the stock market, low levels surely suggest complacency. It is not unexpected, as long bull markets often breed complacency. But the level of worry and fear of a stock market decline has dropped to unusually low levels.

For much of March (through the 24th), the VIX ranged between 11.0 and 13.1, far lower than its median (17.5) or average (20.7) since the summer of 2008. And far, far below highs observed as recently as 2015.1

Even the Federal Reserve appears worried. In its January 31st to February 1st Federal Open Market Committee meeting minutes, the central bank “expressed concern that the low level of implied volatility in equity markets appeared inconsistent with the considerable uncertainty attending the outlook.”2

What are these uncertainties? To name but a few in the near term:

  • Potential additional rate hikes by the Federal Reserve;

  • Likelihood of a European banking crisis with a probable summertime Greek default; Monetary instability if the European election cycle disrupts the future of the eurozone;
  • Potential trade war with China; and

  • U.S. fiscal issues and legislative stalemates delaying or obstructing tax reform.

In December 1996, then Federal Reserve Chairman Greenspan famously implied stock market levels at the time reflected “irrational exuberance.”3 He was early, but he was right (and, quite frankly, he should have been right as he was almost singularly responsible for the dot.com bubble).

If the 1996 stock market reflected irrational exuberance, today’s stock market reflects irrational complacency. Combined with extreme market valuations, investors should be wary, for while sentiment may move markets, eventually reality moves sentiment.

Endnotes:

  1. Federal Reserve Bank of St. Louis. https://www.stlouisfed.org/
  2. Minutes of the Federal Open Market Committee, January 31-February 1. https://www.federalreserve.gov/monetarypolicy/fomcminutes20170201.htm
  3. “The Challenge of Central Banking in a Democratic Society.” Remarks by Chairman Alan Greenspan at The American Enterprise Institute for Public Policy Research, (Washington, DC) 5 December 1996. https://www.federalreserve.gov/BOARDDOCS/SPEECHES/19961205.htm


Defense Wins Games

September, 2015

Football fans always get excited about offensive prowess, but they also know that when it counts, it is the defense that wins games. After a seven-year run in theU.S. stock markets leading to near-record valuations, veteran players know it is time for some solid defense by reducing risk in equity portfolios. The question for investors is: how to play defense in this increasingly uncertain world?

There are three primary ways to reduce equity risk. First, by significantly reducing equity exposure or exiting the equity markets completely. Traditionally, proceeds from equity sales are reinvested in bonds to await cheaper equity prices. This strategy has often worked in prior market downturns – and it may initially work with the next one – but we foresee a day when bonds sell off along with the stock market. It also requires some market-timing expertise.

The second strategy is the traditional diversification model touted by mainstream financial advisers. This model includes a broad mix of higher risk-assets in order to reduce overall portfolio risk. The theory states that, by mixing U.S., international, small and large-capitalization stocks, overall risk is reduced since these stock categories typically do not move in lockstep. This theory has led many investors to actually increase their overall equity portfolio risk (as we have recently experienced) since equities in different corners of the globe can all quickly tumble together during a contagion. So although traditional diversification may prove beneficial during normal times, it fails miserably during periods of systemic crises such as 2008. In our view, record debt levels throughout the world, combined with unprecedented monetary expansion, increase the likelihood of systemic risk.

Hedging, the third and most compelling method to reduce equity risk, uses assets which should increase in value as stock markets decline. Traditionally bonds have performed this task, but as discussed above, those days may be ending. An asset which may now fulfill that role is volatility itself. Today, volatility is a tradable investment vehicle. Commonly referred to as the “VIX”, volatility reflects levels of risk in the stock market and rises as investors become more fearful. In two consecutive trading days in late August (2015), volatility rose by over 45% each day. The increase in volatility from the August low-to-high was over 230%!

However, other than periods of turmoil, the VIX is often flat or slowly declining. Therefore, an active-management approach is essential.

There are several investment funds which employ strategies that allow participation in rising equity markets, yet utilize volatility to eliminate or at least mitigate the risk of bear markets. Some volatility investment vehicles can even have exceptional returns during deep equity drawdowns. Even small positions in volatility can provide substantial benefits during market downturns. Today, volatility should be considered a key asset class and legitimate strategy for playing defense against the risk of a systemic crisis.