And the Election Winner is … Inflation in a Landslide!

Christopher P. Casey

Regardless as to which candidate secures the Presidency on November 3rd (or some subsequent date), the administration must cope with unprecedented federal debt. This debt will only increase for the foreseeable future with record-breaking federal deficits caused by mounting pandemic relief and stimulus spending along with diminished tax revenues. The only available “solution” for the U.S. government to finance such debt and deficits will be through continued massive money printing which will inevitably lead to price inflation. How can investors protect themselves?

What Does and Does Not Cause Inflation?

Due to the widespread misunderstanding of what causes inflation, it first warrants a discussion as to what does not cause inflation. In particular, three inflation fallacies are often cited by mainstream financial pundits and Keynesian economists.

First, the “cost-push” theory of inflation states that price increases in certain commodities force the prices of all goods and services higher. The 1970s are often cited as an example: as increased oil prices permeated the economy, prices for fuel, plastics, and other oil-derived products would increase as well.

But as the price of oil or some other cost-push culprit rises, buyers have less money to spend on other goods and services. Having less money to purchase something else means less demand exists for that other product, and decreased demand reduces prices. So, while some prices may go up, it is ultimately at the expense of other prices which go down. Accordingly, no direct net effect to the overall price level is created by these price changes.

The second inflation misconception is the “demand-pull” theory. Keynesian economic theory believes inflation also materializes when aggregate demand for goods and services exceeds aggregate supply when the economy is at full employment and capacity (which also incorrectly assumes such “aggregates” can diverge from each other). When the economy is at full employment and capacity, increased aggregate demand forces producers of goods and services (soon to be followed by their suppliers) to increase prices. Here lies the origin of the belief in inflation from an “overheated” economy. According to this theory, inflation cannot develop during periods of weak economic growth. But the 1970’s American economy (as well as numerous other economic periods in history – see modern-day Venezuela) clearly disprove this.

Finally, many incorrectly believe inflation cannot develop until the “velocity” of money increases. Typically defined as “the number of times one dollar is spent to buy goods and services per unit of time,” monetary velocity theory originates from the so-called Fisher Equation of Exchange: MV=PT (where the quantity of money [M] times the velocity of its circulation [V] equals prices [P] multiplied by their related transactions [T]). But why would such a formula explain the general price level?

Almost all economists today recognize that the price for any particular good or service derives from the interaction of supply and demand. The “price” of money derives from the same supply and demand dynamic as any good or service. The word “price” in terms of money, to avoid confusion, can be thought of as “value”. If the demand for money increases, its value increases and the prices of all goods and services fall (deflation). If the supply of money increases, its value decreases and the prices of all goods and services rise (inflation). Inflation is simply caused by an increase in the money supply and/or a reduction in the demand for money.

Velocity is not a substitute for demand, but rather of volume. Lots of goods and services may transact at low prices just as they may trade at high prices. In either scenario, “velocity” is high while the demand for money may be low or high. Since velocity is not a substitute for demand, it cannot help explain inflation.

How Does the Federal Debt Situation Affect Inflation?

Federal debt can be deleterious for many reasons. Among other things, it crowds out private investment (by bidding up the price of capital) and must be repaid by taxpayers (in one form or another). The repayment must derive from future taxes or by printing new money to satisfy debt service.

As this chart demonstrates, the U.S. government can never repay its debt based upon tax receipts (nor do politicians have any intention of doing so) (in trillions):1

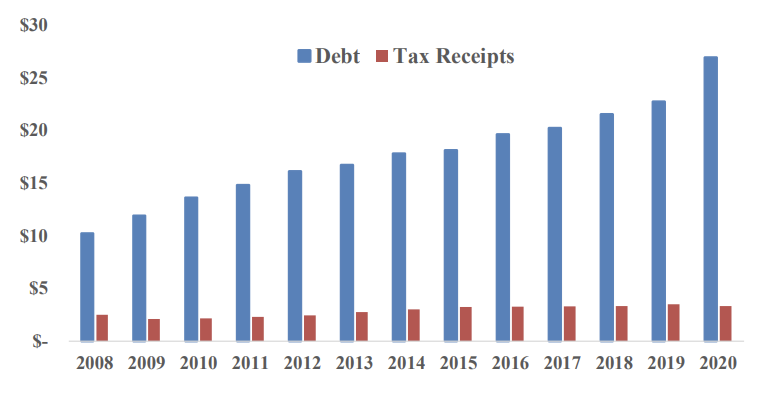
As of September 30, 2020, the federal debt stood at over eight times estimated 2020 fiscal year tax receipts.2

It would take that many years to repay all debt assuming the federal government ceased all spending. Paying back the federal debt through future budget surpluses is unrealistic. And the situation is getting worse.

The Congressional Budget Office, itself always opportunistic about government finances, recently stated “the deficit in 2021 is projected to be 8.6 percent of GDP.”  And that “between 1946 and 2019, the deficit as a share of GDP has been larger than that only twice”.3

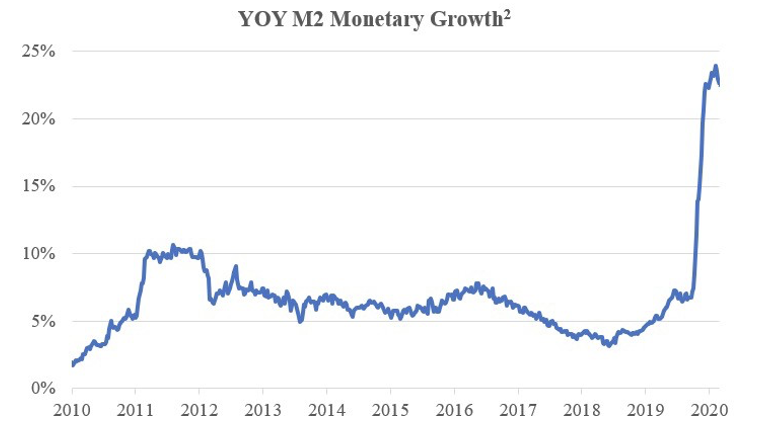
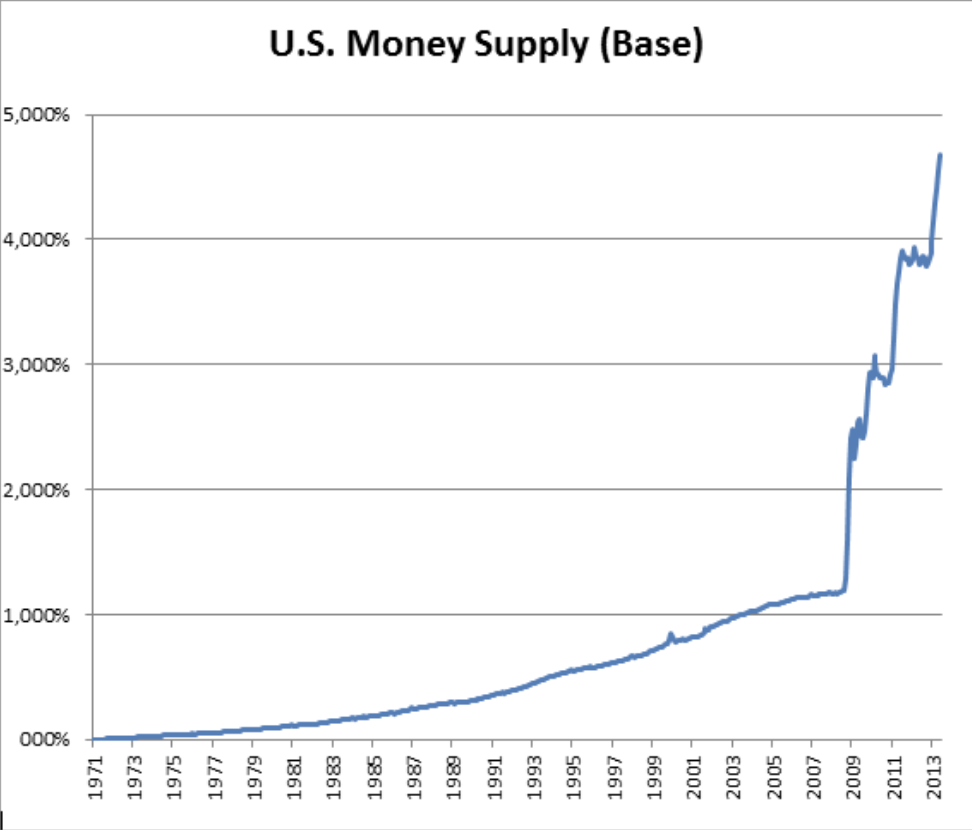
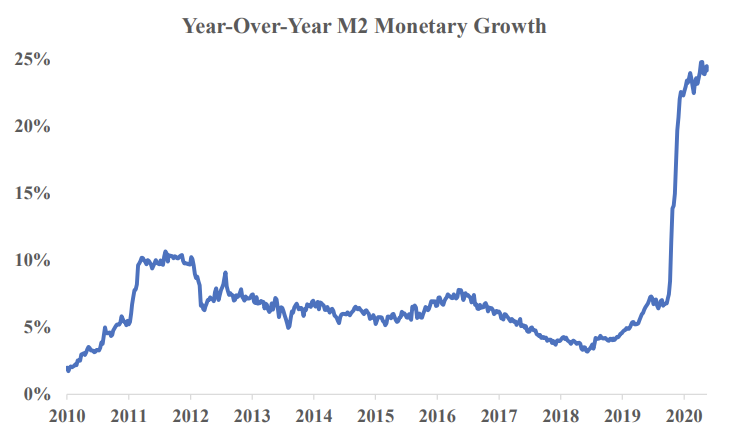
The only means by which the U.S. government can service its debt, let alone its future debt, is through continued, massive monetary expansion. And the Federal Reserve has already started in record-breaking fashion:4

Why Should Investors be Concerned?

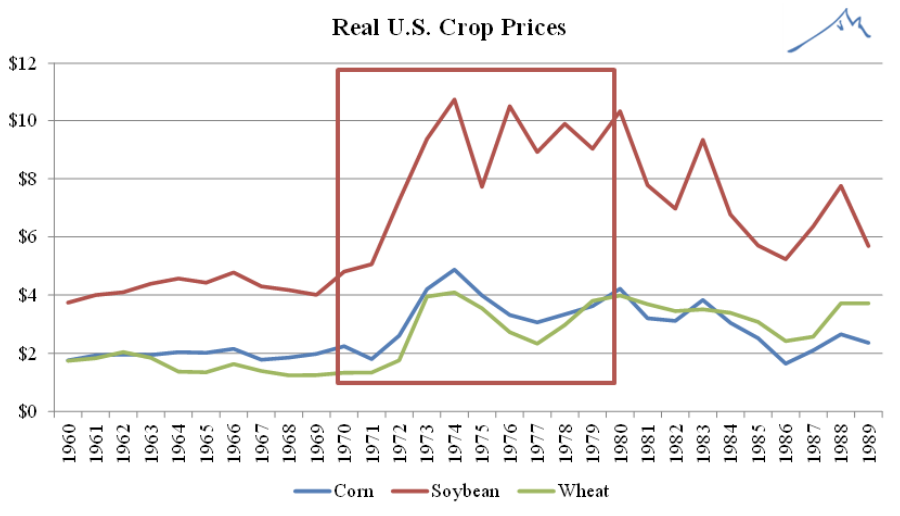
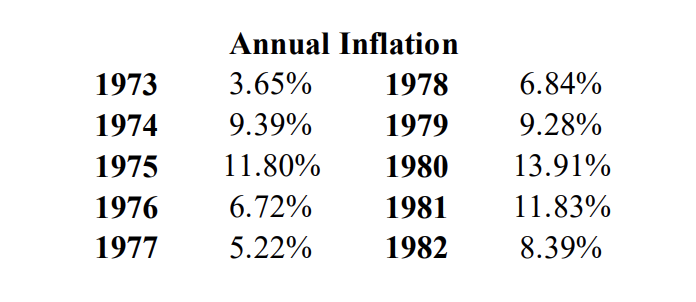
Many U.S. investors have little memory of the 1970’s inflation and thus not only discount the likelihood of inflation, but are largely ignorant as to its negative impact. It bears remembering that the price level did in fact more than double (121% increase) in approximately ten years (from 1973 to 1982).5

The implications for traditional stock and bond portfolios can be devastating. For example, in real terms, a 60%/40% stock/bond portfolio from 1973 to 1982 returned an annual rate of less than 1% (when calculated using the Wilshire 5000 Total Market Index as a proxy for equities and the ICE Bank of America U.S. Corporate Index Total Return Index Value to represent bonds).6

Bonds were especially impacted, losing just over 4% per annum which disproportionately affected retirees, those approaching retirement, and any “conservative” investors.

The 1970s demonstrate that, at least in regards to inflation, stocks and bonds may not provide significant diversification to each other.

What can Investors do to Protect Themselves from Inflation?

Inflation-protection hedges fall into three categories. First, and perhaps most obvious, alternative currencies which are not experiencing the same inflationary pressures. For many years, foreign currencies such as the Swiss franc qualified (until the Swiss National Bank embarked on the same reckless monetary expansion as the world’s other major central banks). But precious metals and cryptocurrencies provide even better protection.

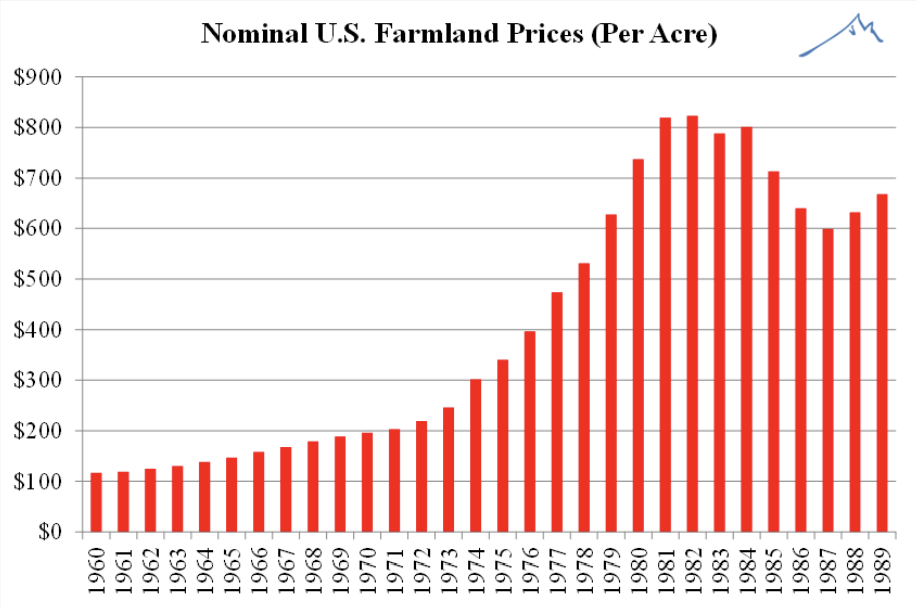
Second, any businesses which have costs in an inflationary currency with revenues tied to a stable (or at least less inflationary) currency profit from the currency valuation discrepancies, and should appreciate dramatically. Primarily, this involves commodity producers such as farmland or energy companies. Some potential examples would be American farmland in the 1970s (and in the future), Brazilian farmland today, or Russian energy companies during any ruble crisis.

Finally, assets utilizing extensive financial leverage (especially with long-term fixed rates) should also perform well. Since inflation helps borrowers to the detriment of lenders (since the money repaid is worth less than when lent), industries with large debt levels such as real estate benefit (especially if they have short- term leases with tenants that renew at the new, inflationary rents). Additionally, as inflation may increase interest rates which deters or limits future borrowing, such industries may experience less future competition, all things being equal.

But the marketplace already knows about these traditional inflation hedge categories. The time to act is before the prices of inflation-protection assets are bid up once inflation appears.

About WindRock

WindRock Wealth Management is an independent investment management firm founded on the belief that investment success in today’s increasingly uncertain world requires a focus on the macroeconomic “big picture” combined with an entrepreneurial mindset to seize on unique investment opportunities. We serve as the trusted voice to a select group of high-net-worth individuals, family offices, foundations and retirement plans.

www.windrockwealth.com

312-650-9822

assistant@windrockwealth.com

Endnotes:

  1. Federal Reserve Board of St. Louis https://fred.stlouisfed.org/
  2. US Debt Clock.org https://www.usdebtclock.org/
  3. “An Update to the Budget Outlook: 2020 to 2030” Congress of the United States Congressional Budget Office. September 2020
  4. Federal Reserve Board of St. Louis https://fred.stlouisfed.org/
  5. Ibid.
  6. Ibid.


What Stops the Stock Market Rally?

August, 2020

In terms of magnitude and shortness of time, the stock market rally since its March lows has been unparalleled. Yet it is especially notable given negative economic reality (an annualized second quarter GDP plunge of 32.9%) and diminished company earnings (S&P500 earnings down 50%).1 Will this rally continue? If not, what stops the stock market rally?

Numerous threats exist: continued economic deterioration (a case can be made a recession hit before the lockdowns) and bankruptcies, trade and geopolitical strife with China, civil unrest and mass unemployment, renewed lockdowns due to a Covid resurgence, the loss of hope for a timely vaccine, and a negative economic viewpoint of a very possible Biden presidency.

Either mitigating or masking these risks stands the Federal Reserve’s unprecedented actions since March. Although it intervened with numerous programs and purchased a multitude of assets, its actions can be neatly summarized as having massively increased the money supply. Measured in M2 (a commonly cited definition of money) year-over-year growth since the end of the last recession, the money supply has exploded.

Monetary expansion is singularly responsible for the stock market rally. As such, to ask what stops the stock market rally is to question what stops the Federal Reserve.

Chairman Powell is unlikely to voluntarily withdraw monetary stimuli. He learned that lesson (it is no coincidence that the late 2018 stock market decline occurred after a long-term slowdown in monetary growth).

So short of this development, what external factors may prevent the Federal Reserve from pursuing its current monetary course? Theoretically, why is it that central banks cannot forever increasingly print money to ensure ever higher equity prices?

Murray Rothbard, the Austrian school economist and monetary expert, addressed this issue:3

. . . the boom is kept on its way and ahead of its inevitable comeuppance, by repeated doses of the stimulant of bank credit. It is only when the bank credit expansion must finally stop, either because the banks are getting into a shaky condition or because the public begins to balk at the continuing inflation, that retribution finally catches up with the boom. As soon as the credit expansion stops, then the piper must be paid . . .

The “shaky condition” of banks may derive from low absolute interest rate spreads and unsustainable financial leverage alongside increasing bad loans. It will develop with sustained negative real rates (as it has in other parts of the world).

Assuming a banking crisis is averted, what about inflation? Few under 50-years old can remember, let alone experienced, an inflationary environment as a consumer, but could one be starting now? According to the August 14th issue of Barron’s magazine:4

A trifecta of inflation numbers came in hotter than expected this past week, with consumer prices, producer prices, and import prices for July all rising at faster paces than economists anticipated. Notably, consumer prices – excluding the more volatile food and energy categories – rose at the quickest clip since 1991.

It may not be starting now, but it could be. And unlike the 1970’s, the Federal Reserve will be unable to deflect blame at greedy business owners or higher oil prices. What they once could play off as coincidence will now reek of causality. And if they stop inflating, then any rally could turn to rout.

Endnotes:

  1. S&P500 Down Jones (95% of companies reporting)
  2. Federal Reserve Bank of St. Louis
  3. Rothbard, Murray N. Economic Depressions: Their Cause & Cure. Ludwig von Mises Institute. 2009.
  4. ‘Stagflation’ Looms Over This Market. Why Some Analysts are Worried. Bellfuss, Lisa. Barron’s. 14 August 2020


The Kitchen Sink

April, 2020

By late January, the die was cast: the virus had a name, it had reached our shores, travel screenings and restrictions were in place, and while not yet declared a pandemic, the World Health Organization declared COVID-19 a “Public Health Emergency of International Concern.”

Yet complacency reigned within financial markets. The stock market continued its march to new highs (reached on February 19th). The Federal Reserve, in its January 29th press release, failed to mention coronavirus in the list of variables it “will continue to monitor” save for a generic nod to “global developments.”[i] It began the missive by mentioning recent data “indicates that the labor market remains strong and that economic activity has been rising at a moderate rate.” Famous last words.

It was not until a full month later, and only after the U.S. stock market suffered its worst week since the Great Recession, did the Federal Reserve act. It was rather weak work. On February 29th they issued a statement describing how they were “closely monitoring . . . the evolving risks of the coronavirus to economic activity.”[ii] On March 3rd, they cut interest rates by a not uncommon 50 basis points.

But on March 15th, the Federal Reserve completed its year-to-date journey from satisfaction to concern to sheer panic. That Sunday’s emergency announcement marked the first of several major measures meant to stop the bleeding on Wall Street and stem the tide of anticipated economic hardship.

The Federal Reserve’s actions are unprecedented in both magnitude and breadth and will generate serious repercussions for investors down the road.

While the financial media widely reported how the March 15th actions lowered the federal funds target rate to 0.00-0.25%, it missed the far more drastic action of eliminating bank reserve requirements. Previously, banks had to retain 10% of demand deposits which meant they could theoretically increase the money supply by ten times. Now no limit exists to their monetary expansion.

March 23rd brought more unprecedented action when the Federal Reserve announced it was buying $375 billion in Treasuries and $250 billion in mortgage backed securities that week. For comparison, 2008’s QE1 was $700 billion (comparable in size) and it took months to deploy. It also announced it would continue buying assets “in the amounts needed” to support the economy. It started buying, for the first time ever, corporate and short-term municipal bonds.

Then, on April 9th, the Federal Reserve announced $2.3 trillion in loans to “support the economy.” Not content with corporate and municipal, it started buying junk bonds. It could have saved itself the trouble of buying various bond sectors by simply writing a check for most of the office real estate ($2.5 trillion), farmland ($2.7 trillion), or multi-family housing property ($2.9 trillion) in the U.S.

The Federal Reserve’s substantial and sustained efforts to pull the economy out of the 2008 Great Recession increased its balance sheet by $3.6 trillion in just over six years. It just added $2.3 trillion to its balance sheet in a month.[iii] This isn’t throwing the kitchen sink at a problem – it’s lobbing in the entire kitchen.

Even if the Federal Reserve stopped further actions and ceased its announced programs, its balance sheet will continue to swell as it finances proliferate spending by the U.S. Treasury. Given such actions as the CARES Act and its Paycheck Protection Program, the Congressional Budget Office estimates the 2020 deficit will reach $3.7 trillion – a multiple of anything seen in the wake of the 2008 Great Recession.[iv] This estimate will only increase with any additional spending initiatives by Congress.

Money supply has already exploded and is at the fastest rate in 92 months.[v] It is just getting started.

In response to 2008, the Federal Reserve increased the money supply dramatically, but much of that was held by commercial banks in excess reserves at the Federal Reserve where they earned some small, yet risk-free, interest. This time is different. Not just in magnitude, but in breadth, which is to say by recipient. No longer will money be injected into banks and primary dealers, but to companies and individuals who make up the economy as whole.

Inflation will ensue. Not right away, for the deflationary forces of loan repayments and defaults will counteract and potentially overwhelm inflationary forces. But that will be somewhat temporary.

Until then, it is an opportune time to build up inflation protections for an investment portfolio: certain types of real estate (e.g., farmland and some residential rental property), precious metals, and cryptocurrencies.

Endnotes:

  1. Federal Reserve Bank of St. Louis. Timeline of Events Related to the COVID-19 Pandemic. https://fraser.stlouisfed.org/timeline/covid-19-pandemic#14
  2. Federal Reserve Press Release. 29 Jan 2020. https://fraser.stlouisfed.org/title/federal-open-market-committee-meeting-minutes-transcripts-documents-677/meeting- january-28-29-2020-585165/content/pdf/monetary20200129a1
  3. Federal Reserve Bank of St. Louis. Federal Reserve Total Assets. https://fred.stlouisfed.org/series/WALCL
  4. “Coronavirus Relief Pushing U.S. Deficits to Staggering Heights” Associated Press. https://www.pbs.org/newshour/politics/cbo-says-deficit-to-reach-3-7-trillion-in- economic-decline
  5. “Money Supply Growth Surges to 92-Month High” McMaken, Ryan. Mises Institute. https://mises.org/wire/money-supply-growth-surges-92-month-high


SOMA for the Masses

February, 2020

The world’s stable now. People are happy; they get what they want, and they never want what they can’t get. They’re well off; they’re safe; they’re never ill; they’re not afraid of death; they’re blissfully ignorant . . . they’re so conditioned that they practically can’t help behaving as they ought to behave. And if anything should go wrong, there’s soma.

– the Controller in Brave New World by Aldous Huxley, 1932.

In Huxley’s story, soma is a government-provided drug which helps people escape the real world by artificially enhancing their joy, arousal, and overall sense of well-being. Coincidentally, in our financial and economic story, the Federal Reserve (“Fed”) increases their SOMA (System Open Market Account) by buying assets with freshly printed money for the same purpose. So, while Huxley’s future citizens drank soma or ate it in infused strawberry ice cream, today’s financial markets consume the Fed’s monetary infusions to the same effect.

Quantitative easing waned starting in 2017 as the Fed actively sold bond holdings (for which they receive money which then leaves economic circulation). As detailed in the chart below, this situation reversed in late 2019.

Ostensibly, the reason was to “calm money markets” last September when they experienced . . .

. . . funding shortages Monday and Tuesday [September 16th and 17th], driving the rate on one-day loans backed by Treasury bonds – known as repurchase agreements, or repos – as high as 10%, about four times greater than last week’s levels.(1)

The Fed’s interventions in the repo market have continued unabated. On February 4th alone, Fed purchases totaled $94.45 billion. Since repos are reversed in a fairly short time frame, the impact of any intervention must be netted against such reversals. But even after such considerations, the overall level of outstanding repos owned by the Fed stands at $187.2 billion.(2) All of this comports with the Fed’s operating policy as detailed in a December 12th statement.(3)

But could there be another reason? The fact that these repo operations serve as de facto quantitative easing without the stigma of citing economic concerns cannot be dismissed as a convenient coincidence. Since December 2018, when the stock market decreased dramatically and Treasury Secretary Mnuchin startled Wall Street with his “ample credit” statement at Christmastime, the Fed has been a bit scared and highly reactive.(4) The repo market simply provides them public relations cover to continue their post-2008 monetary mischief as measured in the SOMA. The financial markets are truly living in a Brave New World.

Endnotes:

  1. McCormick, Liz and Harris, Alex. “Fed’s First-in-a-Decade Intervention Will Be Repeated Wednesday” Bloomberg. 17 September 2019.
  2. Derby, Michael. “New Fed Repos Total $94.45 Billion, Total Temporary Money Ticks Up To $187.2 Billion” The Wall Street Journal. 4 February 2020.
  3. Statement Regarding Repurchase Operations. Federal Reserve Bank of New York. 12 December 2019.
  4. Paletta, Damian and Dawsey, Josh. “Treasury secretary startles Wall Street with unusual pre-Christmas calls to top bank CEOs” The Washington Post. 23 December 2019.


Commemoration of a Canard

August 13, 2013

Commemoration of a Canard

“I have directed Secretary Connally to suspend temporarily the convertibility of the dollar into gold.” – Richard M. Nixon, August 15, 1971

In the spirit of commemoration, we cannot allow the 42nd anniversary of Nixon’s speech go without comment. Addressing the nation to “outline a new economic policy”, he failed to disappoint: wage and price controls were instituted, the automobile industry was browbeaten into reducing prices, and a 10% tariff was assessed on all imports. All this before Nixon announced his grandest exploit – the termination of U.S. commitments to exchange gold for dollars with foreign governments.

Previously, the Federal Reserve’s ability to issue new money was limited by the threat of depleting the government’s gold reserves. Printing too many dollars led foreign governments to start favoring gold over holding depreciating U.S. dollars. Nixon’s actions (which proved not to be temporary) ended the last vestige of a gold standard, erased all limits on the unchecked printing of money, and effectively ended the world’s currency system (known as Bretton Woods) in place since World War II.

Whether Nixon was sincere in his belief that these actions would truly, to use his terms, “nurture and stimulate” the economy or if – perchance – he knew better and deceived the American people, we have no comment. We reserve our commentary not to purpose, but to effect.

And the effect was an unmitigated disaster. Nixon promised Americans that any talk of inflation with an unconstrained Federal Reserve was a “bugaboo” and that his actions would actually “stabilize the dollar.” (If you wish to listen to Nixon in his own words, the latter part of his speech can be viewed here). According to him, the risk of Americans paying higher prices was extremely limited:

If you want to buy a foreign car or take a trip abroad, market conditions may cause your dollar to buy slightly less. But if you are among the overwhelming majority of Americans who buy American-made products in America, your dollar will be worth just as much tomorrow as it is today.

Despite these assurances, inflation became a hallmark of the 1970’s as the unimpeded Federal Reserve zealously increased the money supply. The year 1973 experienced inflation of 9%, 1974 brought 12%, and the decade was closed out with a peak inflation rate of 14% in 1979. Since the date of Nixon’s speech, the dollar has lost 83% of its value. One dollar then is worth 17 cents today. What will it be worth tomorrow?

We cannot say with certainty, for while the creation of money causes inflation, the effect does not correspond fully in magnitude. Nor is it immediate. In fact, the lag between the expansion of the money supply and the onset of inflation could be years. If so, what expectations are reasonable based upon the Federal Reserve’s actions since 2008? The scary answer can be found in this chart.

To tweak a famous quote by Winston Churchill, wiping away the last traces of the gold standard was not a new beginning for U.S. monetary policy. It was not even the end of the beginning. But it was, perhaps, the beginning of the end.


The War on Cash Explained

The phrase “the war on cash” refers to the deliberate efforts by governments and central banks to reduce and/or eliminate the frequency and size of cash transactions within the economy.

Since the 2008 crisis, these efforts have accelerated worldwide.

Will the U.S. eventually outlaw cash?  WindRock interviews Dr. Joseph Salerno, Professor of Economics at Pace University, author, and a leading expert on this topic.

Dr. Salerno discusses:

  • Why governments and central banks truly desire to eliminate cash transactions;
  • How cash transactions are being systematically outlawed or made impossibly inconvenient throughout the world; and
  • What event will eventually eliminate cash transactions in the U.S.


Are Gold Stocks Good Long-Term Investments?

Today, many mainstream financial pundits fail to see gold and silver mining stocks as viable investments. Inappropriately, they blindly compare gold stock returns with various broad stock index returns since 2008 which leads to erroneous conclusions.

But others disagree. WindRock recently moderated a panel discussion that featured Peter Schiff, Doug Casey, and Adrian Day on the appropriate role and opportunity gold and silver mining stocks represent.

The panel discussion addresses such questions as:

  • Why comparing gold and silver mining stock returns with broad stock market indices can be misleading;
  • Which investment criteria investors should utilize in selecting gold and silver mining stocks;
  • When physical gold and silver should be considered instead of gold and silver equities; and
  • Where the price of gold is eventually headed.


End the Fed: an Interview with Dr. Ron Paul

Most mainstream financial pundits view the Federal Reserve as a bastion of economic wisdom and a stalwart protector against inflation, recessions, and economic turmoil. Dr. Paul disagrees. 

His unique perspective on the Federal Reserve was developed from his tenure on the House Financial Services Committee and his long-term adherence to the Austrian school of economics.  Rather than viewing the Federal Reserve as the solution, he sees it as the cause of many economic problems.

Dr. Paul discusses:

  • Which Federal Reserve chairpersons have been the best – and worst;
  • Why he sponsored bill HR 1207 to audit the Federal Reserve (and what he expected to find);
  • How closely central banks coordinate financial and monetary actions;
  • Why Chairman Powell drastically changed monetary policy over the last 18 months; and
  • What America’s best, most realistic hope is for exiting our debt burden and avoiding economic calamity.


Combating Inflation with Corn

Christopher P. Casey, CFA®

chris.casey@windrockwealth.com

U.S. farmland values have been growing. Since 2009, the nationwide per-acre value has risen almost 40% while prime farmland properties have sold for record prices. This appreciation derives from legitimate supply and demand trends in agricultural commodities. These developments include an increasing world population, continued limitations on arable land, fresh-water constraints, declining growth in crop yields, and increasing caloric consumption in developing countries. These trends are powerful, likely to continue and carry a worldwide impact. But there is a far more important reason to invest in farmland today – one that is not reflected in current values.

Farmland is an inflation hedge. Allocating part of one’s investment portfolio to farmland (particularly farmland in nations that will experience relatively high inflation) will not only protect investors but will allow them to profit – perhaps immensely.

Why farmland and not some other real estate asset class? Why not own a Real Estate Investment Trust (REIT) which holds office buildings, hotels, retail shopping malls, or the like? All things being equal, it is true that all real estate should perform relatively well in an inflationary environment. Unfortunately, in the next two to ten years, investors will also likely have to contend with severe economic downtowns interrupted by weak “recoveries.” Picture the U.S. in the 1970s, but potentially far worse. In such situations, the office building cannot attract tenants, the hotel goes vacant, and the retail shopping mall loses its anchor stores. Farmland has no vacancy issues.

In an inflationary recession, farmland values should thrive. Unlike other real estate asset classes, farmland sells its products to an international marketplace. Corn, soybeans, and wheat will fetch a similar price in any market. Accordingly, as a nation’s currency depreciates relative to other currencies, its exports become cheaper. Devastating inflation in the U.S. will hurt American consumers at the grocery store, yet whet the appetite of foreigners. As demonstrated in the following graphs, the impact of the 1970’s U.S. inflation provides some precedent. Grain exports rose significantly not only in absolute volume but also relative to global exports.1

Perversely, this provided a double-whammy for American consumers. As the law of demand dictates, more demand generates higher prices. So agricultural products rose not just in nominal terms, but also in real terms. In fact, the 1970s experienced some of the highest prices ever for U.S. agricultural commodities after accounting for inflation.2

Rising crop prices increased farm revenue which directly translated into higher farmland values. For the ten-year period ending in 1981, U.S. farmland values rose 303% while inflation increased 118%. Farmland appreciation was especially dramatic when viewed in the 30-year period from 1960 through 1989.

And how did traditional investment vehicles like stocks and bonds perform during this ten-year period? In real terms, stocks lost value (up 115% which is less than the aforementioned 118% increase in the consumer price index). Worse, bonds lost almost 70% of their real value (a 10-Year Treasury Bond total return index increased by only 38% in nominal terms). Investors experienced a decade of massive losses.3

Despite this historical precedent, the investment community – to this day – ignores farmland. In fact, few wealth managers will even consider farmland as an investment for their clients. Why? First, the wealth management industry rarely adopts a macroeconomic viewpoint, and certainly not one which deviates from Federal Reserve or other government agency prognostications. Those firms which do hold a macroeconomic opinion embrace Keynesian economic theory which leads them to share the mainstream’s skewed economic expectations. Austrian economists are rare in the wealth management industry, and thus few wealth managers foresee a period of inflationary recessions.

Second, the wealth management industry remains focused on real estate benchmarks that exclude farmland. Therefore wealth managers solely consider traditional real estate asset classes. Absent a change to the real estate benchmarks, no advisor or wealth management firm will act as a “prime mover” and incorporate farmland investments. In the wealth management industry, being the first to deviate from standard investment portfolio benchmarks invites repudiation and entails career risk. So much the better for today’s astute investors, since the price of farmland excludes demand from their clients.

Inflation will come. Not just in the U.S., but in the developed world at large. It may not happen this year. It may be preceded by a brief deflationary period. But it will arrive, regardless of the continued “tapering” of the Federal Reserve’s quantitative easing program. Once a lethal dosage has been administered, reducing the size of additional injections does not cure the patient (for additional information on U.S. inflation, please visit the WindRock article Inflation: Why, When, and How Much? located here). As the U.S. monetary explosion since 2008 dwarfs the increase of the 1970s, the coming inflation may be quite ugly. With the exception of precious metals, few investments can rival the inflationary protection offered by farmland.

Endnotes:

1 U.S. Department of Agriculture. Production. Supply & Distribution (electronic database). www.fas.usda.gov/psdonline. July 2012.

2 U.S. Department of Agriculture. National Agricultural Statistics Service. http://quickstats.nass.usda.gov/

3 InfoPortfolio, LLC. http://dqydj.net/sp-500-return-calculator/ and New York University http://www.stern.nyu.edu.

About the Author

Christopher P. Casey CFA® is Managing Director at Windrock Wealth Management (www.windrockwealth.com)

Combining a degree in economics from the University of Illinois with a specialty in the Austrian School of Economics, Chris designs investment porrtfoliios to maximize rreturns and minimize risk in ttoday’s world oof significant government iintervention. Chris can be reached at 312-650-9602 or at chris.casey@windrockwealth.com.

All written content on this site is for information purposes only. Opinions expressed herein solely those of WindRock Wealth Management, LLC. and our editorial staff. Material presented is believed to be from reliable sources; however, we make no representations as to its accuracy or completeness. All information and ideas should be discussed in detail with your individual advisor prior too implementation.